Over the past year, we’ve gone from a single Java server running all analytics to a multi-node data pipeline. Along the way, we’ve refined our metrics for all parts of the business: from web and mobile analytics, to investment research, to trading and operations. We build metrics dashboards for everything we do, empowering us to make bottom-up, metrics-driven decisions. In a recent post, we explained why we bet on statistics to scale our bottom-up culture. This post gives a brief overview of the technology we use, with some details of the key lessons we’ve learned along the way.
System Overview
Our data pipeline is, by design, fairly simple. We load data from our online systems every hour. We store all data in Avro files. We use Avro because it integrates with Hadoop, and Avro schemas add type safety to our data.
We use Hadoop for offline batch processing, via Cascading. We prefer Cascading to raw Hadoop, because Cascading provides a rich library of common data operations, like join, group by, and filter, on top of Hadoop’s basic map and reduce capability.
We also use Cascading to load data from Avro files into our data warehouse. We run all ad-hoc queries against the data warehouse. Additionally, we support views in our data warehouse. When needed, we migrate view computations to Cascading to enhance query performance. We also export data from our data warehouse into dashboards, and do statistical evaluation of query results in R.
Finally, we load derived data stored in Avro files into our online systems. This enables us to incorporate offline data processing back into the product.
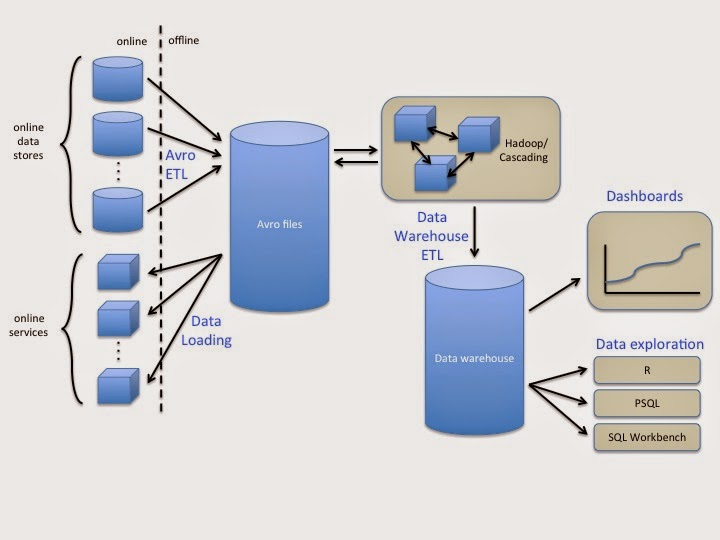
Consider an example of how data flows through our system: We load data about deposits, trades, and withdrawals from our production system into Avro files. A Cascading job rolls this information up into daily account metrics for each account, tracking things like account balance and daily rate of return. In our data warehouse, we further roll up per-account metrics into a company-wide assets-under-management view, which we export into a popular dashboard. We also load account metrics data into R, along with web and mobile data, where we use machine learning to analyze factors affecting financial attention.
Lessons Learned
While building this pipeline, we developed a set of best practices around data. These insights map to any data platform, irrespective of particular technology choices. In our opinion, these learnings have been central to scaling our data platform.
Lesson 1: Load all data
We load almost all data from our online systems into our offline systems. This includes more than just the data from our production databases. We also load data from databases we don’t directly access from our production code, like our build server and issue tracker. By having all data available in the data platform, we’re empowered to answer whatever questions we want, whether about the business at large, some particular product or feature, or operations.
In slight contradiction to what I just said, there are classes of data we specifically chose not to load into our data platform. The first is any data for which retention is in violation of applicable regulations. We regularly audit our data systems for regulatory compliance. The second is sensitive client data, like personally identifiable information. We don’t need this data for aggregate analytics, and we protect our client’s data first and foremost. We also take additional security steps, such as encrypting all offline resting data, to further protect this data.
Ideally, all data we load into our system would be immutable, that is, no records would ever change. This is the approach recommended in the lambda architecture because it lets you reconstruct the full history of changes when doing analysis. Most of our transactional systems log changes, so we can use this for extract-transform-load (ETL). Unfortunately some systems, particularly third-party systems, are only able to provide data in its present state at the time we run ETL. For these systems, we load a snapshot of the data into our system, augmented with the time of the snapshot. This lets us approximate the immutable history of data based on point-in-time snapshots. While we miss records that came and went between ETL steps, we are at least able to track trends over time.
Lesson 2: Design for quality
Data is only useful if it is correct and fresh. In a multi-system data pipeline, it is easy to violate either condition. Freshness is easy to check. We have monitoring systems at all stages of the pipeline to validate data freshness is within our SLAs. We get alerted when these SLAs are violated. Because all upstream components will eventually fail, we make our ETL and batch processing jobs automatically catch up from where they left off, rather than just process the most recent data. This allows the system to self-heal when the upstream component is brought back online.
Correctness is a harder problem. We put several checks in place to ensure data correctness. One of common way to compute the wrong thing is to misunderstand what an input data source represents. To protect against this and other computational errors, we code review all ETL steps, Cascading jobs, data warehouse views, dashboards, and R analytics. This gives the reviewer a chance to point out misunderstandings before they affect our data systems.
To further ensure computational correctness, we write rigorous unit tests to validate both happy path and edge cases. In addition to helping us work through issues as we go, these tests help us ensure new changes don’t break existing functionality. To facilitate good testing practices, we’ve built framework classes to reduce the burden of testing. For an example, see our earlier post on Testing Cascading applications.
Finally, we run data quality checks on live data to make sure it satisfies expected invariants. We have two basic types of data quality checks we can write. The first are Cascading jobs that run sanity checks on our raw and derived Avro files. These can detect issues in our data pipeline itself as well as issues in our underlying production systems. Second, we build sanity checks based on SQL statements that we run against our data warehouse. As a simple example, we check all tables for duplicate entries. This is a common failure mode, since our data warehouse does not have a way to ensure uniqueness when loading data. The code we write to test for duplicates looks like this:
assertNoDups(“trades”, “id”);
This ultimately unrolls into checking the counts are equal that result from running the following two SQL queries:
SELECT COUNT(DISTINCT(id)) FROM trades;
SELECT COUNT(id) FROM trades;
Lesson 3: Make it easy
Our goal in building this data platform is to improve the services we offer our clients by using data to drive decisions. This only happens if the data is readily available to whatever person or system needs it. We’ve developed a layered approach to making data accessible, starting with our dashboards.
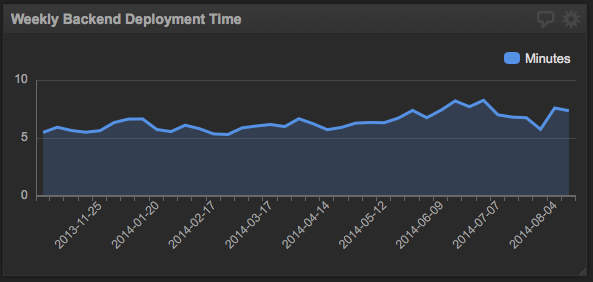
Dashboards are the first way we interact with data. We use dashboards to quickly see how we’re doing and look for improvement opportunities. We’ve built dashboards for each area of the business. We use dashboards to track things like new-feature adoption, the business at-large, and operational performance. As an example, this dashboard tracks service deployment times:
The next layer in our data stack is the data warehouse. Here, we run ad-hoc queries. When needed, we process the results of these queries in R. We combine views and offline-computed tables to make the data easy to understand and query. Our online production data is generally too low-level to be useful in analysis without this pre-processing step.
Finally, in both our ETL and Cascading workflows, we’ve added framework classes to simplify the work required to process data. As an example, we’ve built type-safe Java wrappers around the core Cascading classes to reduce errors from passing strings around and eliminate boilerplate code. In particular, for a simple Filter condition, we would write:
public boolean isRemove(Source clientSourceTable) {
return !source.getIsFirstClick();
}
instead of the raw Cascading equivalent:
public boolean isRemove(FlowProcess flowProcess, FilterCall<Void> filterCall) {
TupleEntry entry = filterCall.getArguments();
boolean isFirstClick = entry.getBoolean(“is_first_click”);
return !isFirstClick;
}
Why this matters
While these are not our only learnings about scaling our data platform, they have been important. They’ve enabled everyone in the company to make data-driven decisions. Loading all data into our platform allows us to ask any question we want. Our rigorous quality checks enable us to trust the results of our analyses. Because we’ve made data easily accessible, each employee is empowered to use data when making decisions on how to best help our clients manage their investments.