Unpredictable Scaling
Wealthfront’s position as a financial services company presents interesting scalability challenges. The announcement of a stock market decline for instance can cause a large number of our clients to simultaneously pick up their phones, load their Wealthfront accounts, and look to see how the market activity has impacted their finances. After one particularly steep market decline on February 5th of this year, Wealthfront’s site (along with those of Vanguard, TD Ameritrade, Betterment, and T. Rowe Price) had trouble responding to the unprecedented surge in traffic. Handling sudden activity spikes poses different challenges than scaling a rapidly growing user base and requires both a forward thinking scalability approach as well as a hard, careful look at existing performance issues.
After that outage, Wealthfront Engineering defined a goal of being able to serve 10x expected load at any given time and started chipping away at that goal from several different angles. We knew there was a performance bottleneck somewhere in our database layer, or in the connection between our backend Java services and database layer. We could observe the symptoms of backend services waiting long periods of time for database connections during extreme load spikes, but the root cause was not immediately clear from our existing monitoring or metrics. In this blog post we will describe the process we followed to refine our root cause hypothesis and what we learned along the way. Future blog posts will go deeper into each issue we identified and talk about how we solved them.
Backend and Storage Architecture
Our backend is a Java service oriented architecture with MySQL databases as our online-storage layer. The combined architecture looks like this:
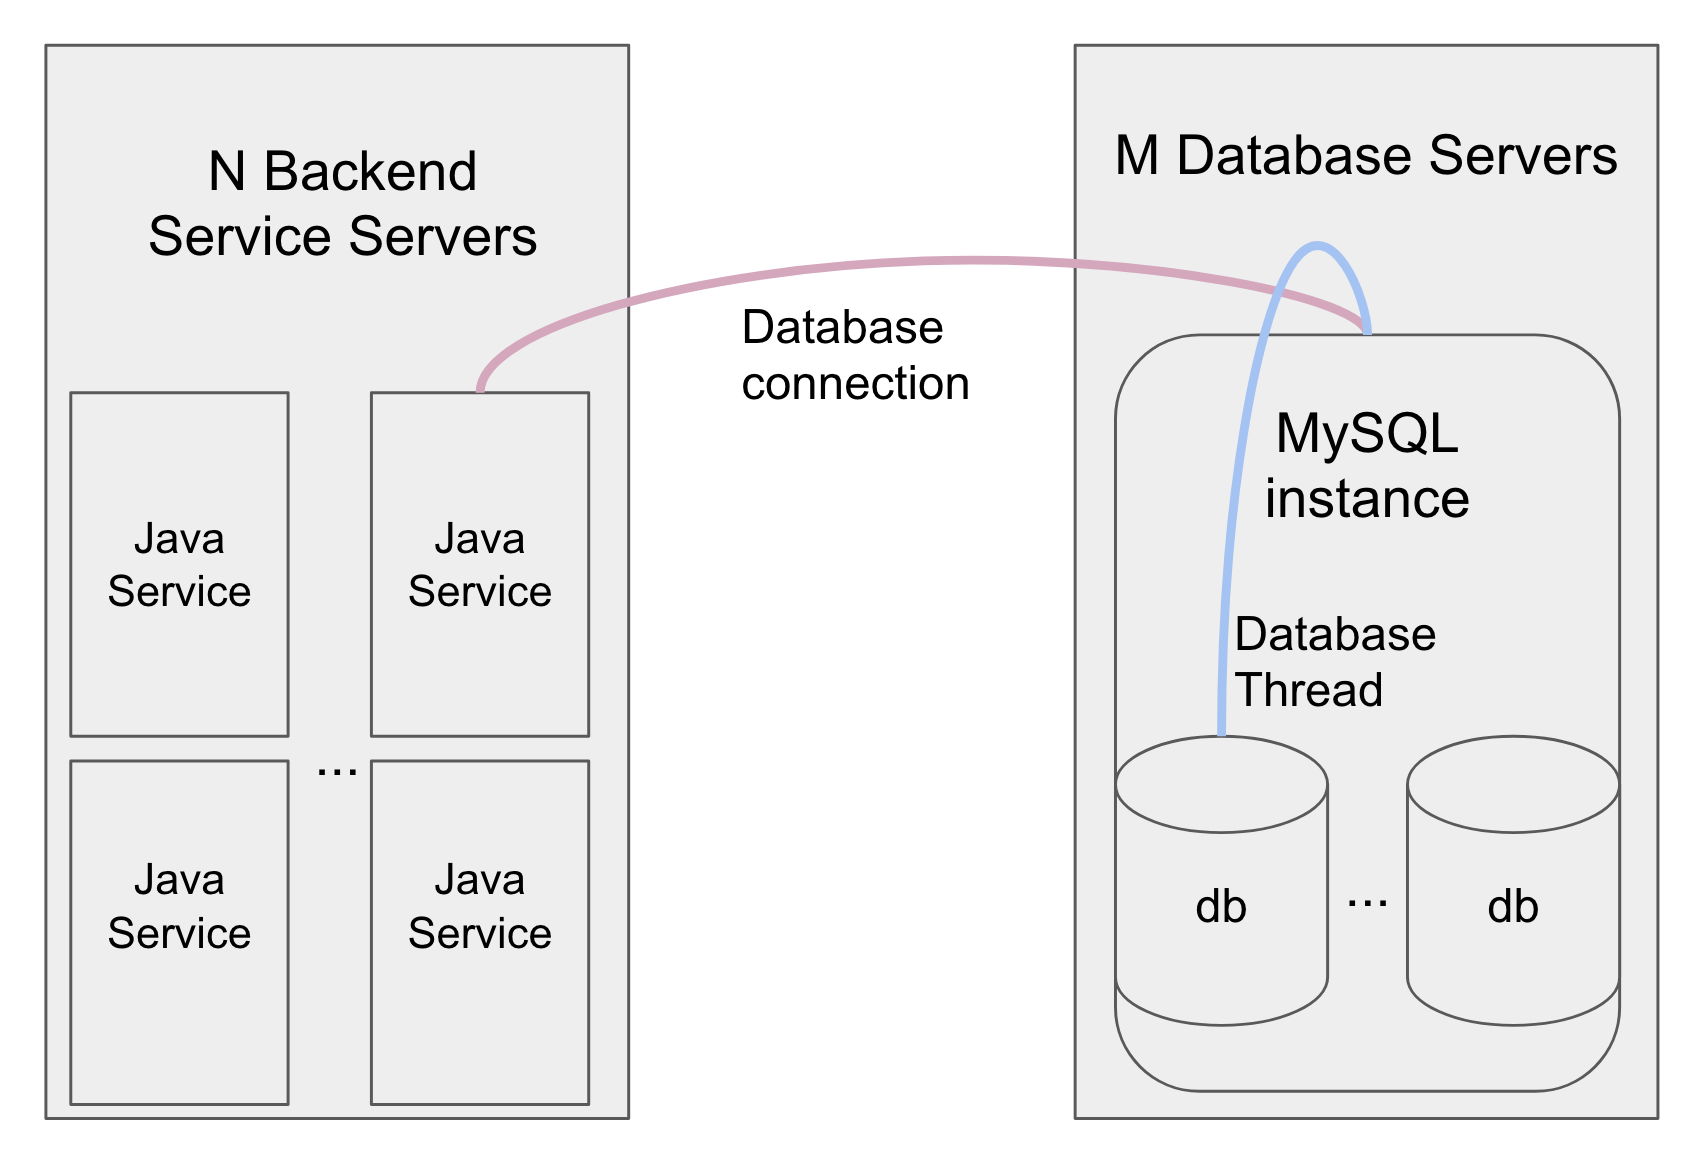
We use C3P0 connection pools to handle the connections between services and databases. Databases are clustered so while each service only connects to one database, each database receives connections from several different services.
Investigating Each Component
We began by iterating over several bottleneck hypotheses, starting at the lowest level.
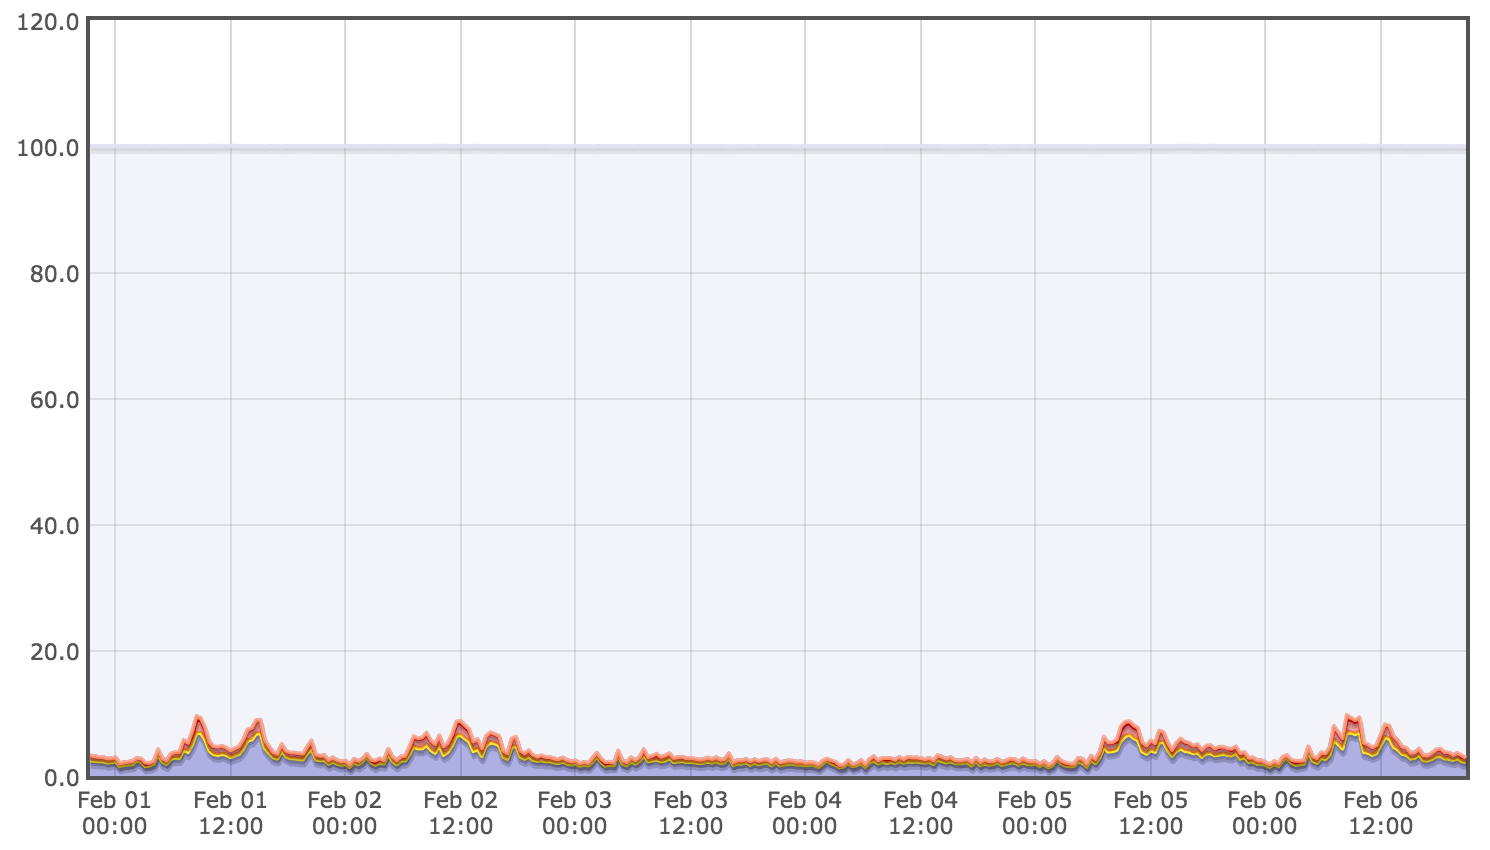
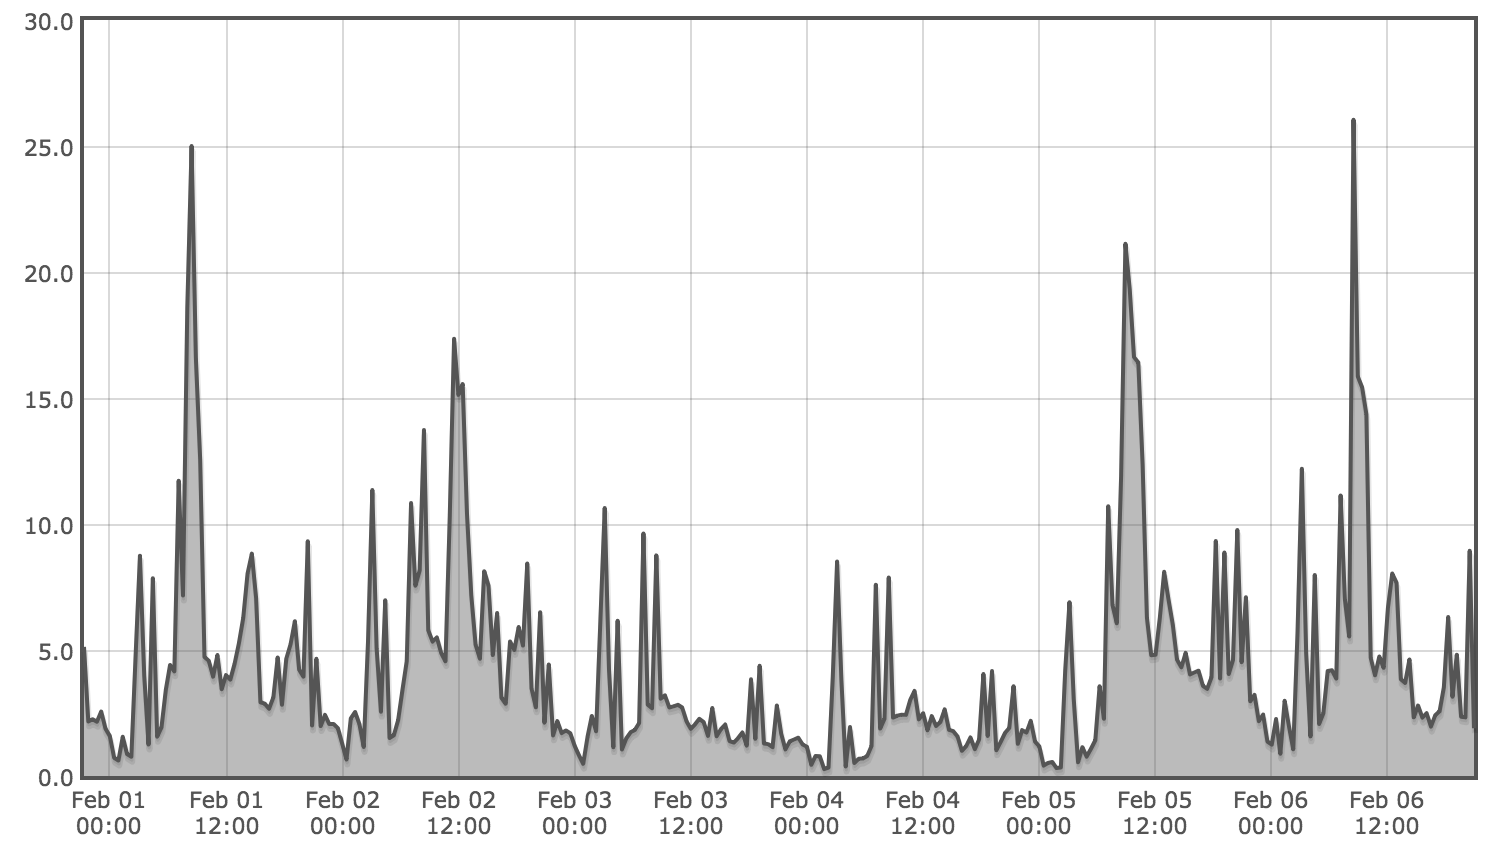
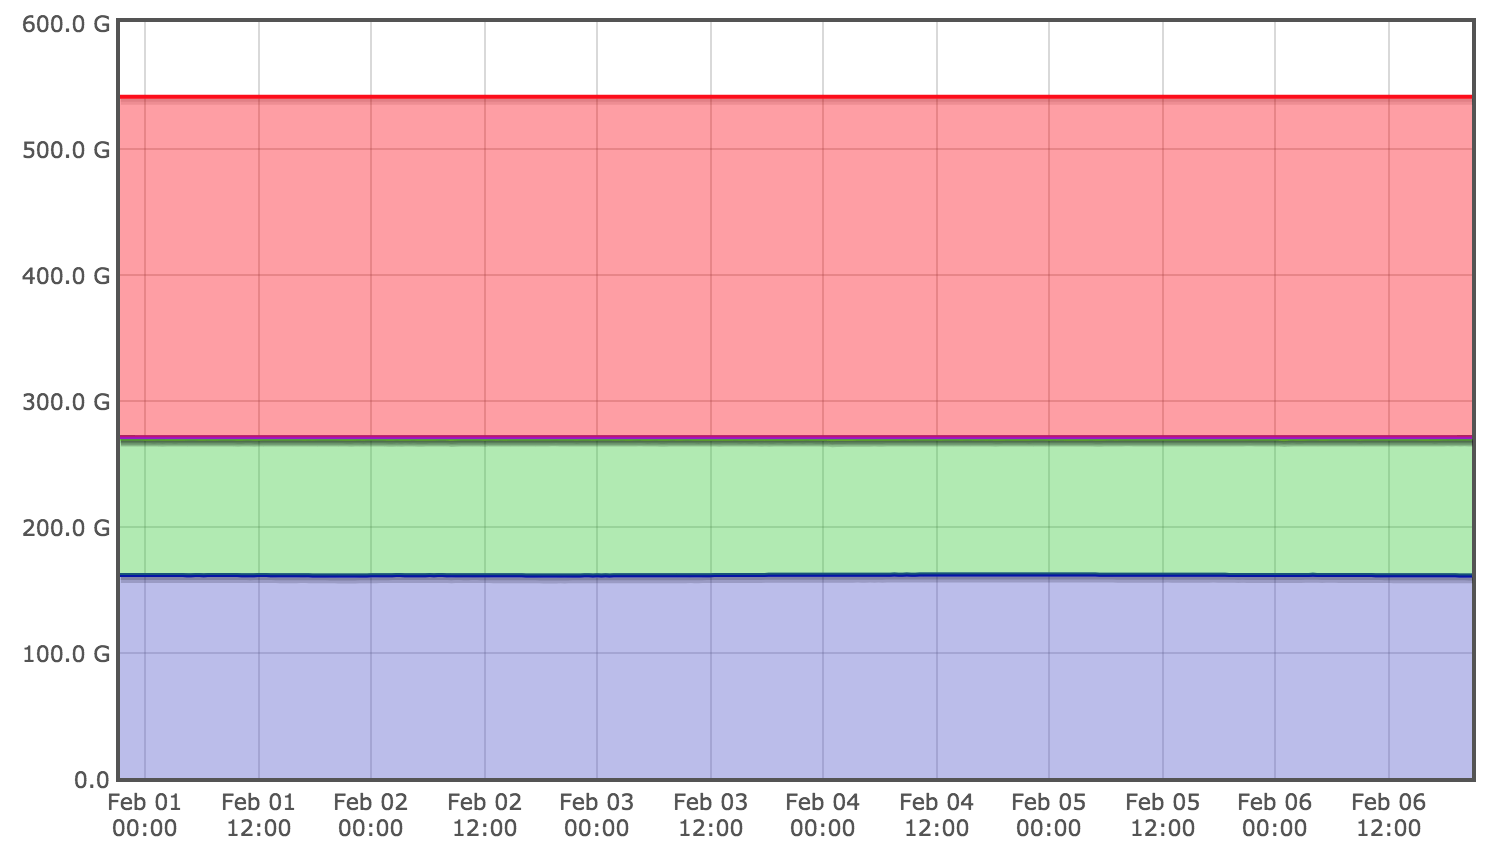
If the databases were resource constrained then they would be unable to respond to the increase in queries that we would expect from a sudden increase in user load. We examined metrics on the physical resources of the database servers but found that they all seemed regularly underutilized, with no sign of utilization spikes during the time periods of user activity spikes. Below are example hardware metrics for the week of the outage showing low and consistent utilization for core hardware metrics: CPU, disk I/O, and memory:
Furthermore, database metrics did not show an increase in query load of the same magnitude as the increase in user load we had experienced. This indicated that we were hitting a bottleneck before queries reached the database, which gave us a strong hint that our problem was higher up the stack.
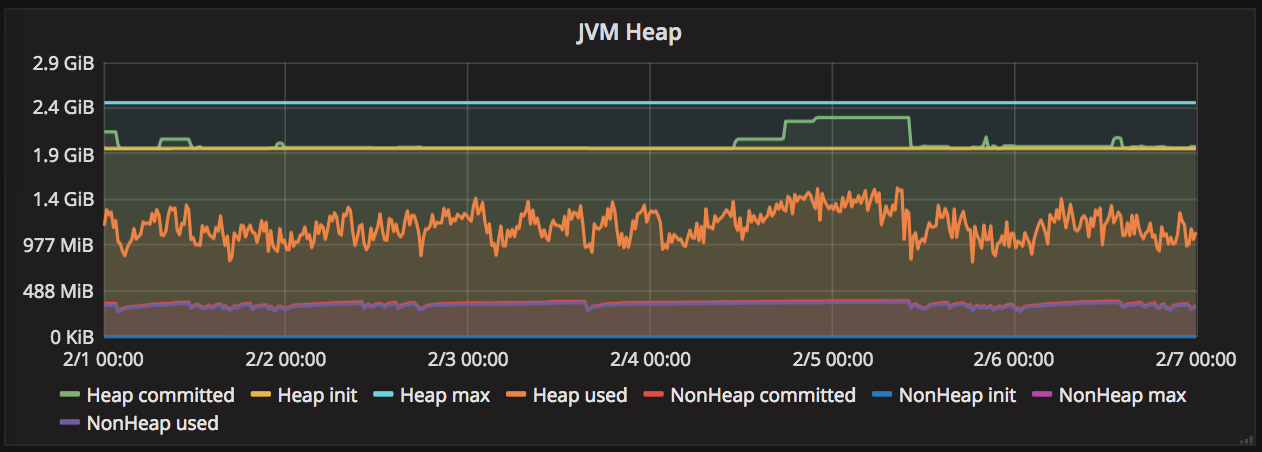
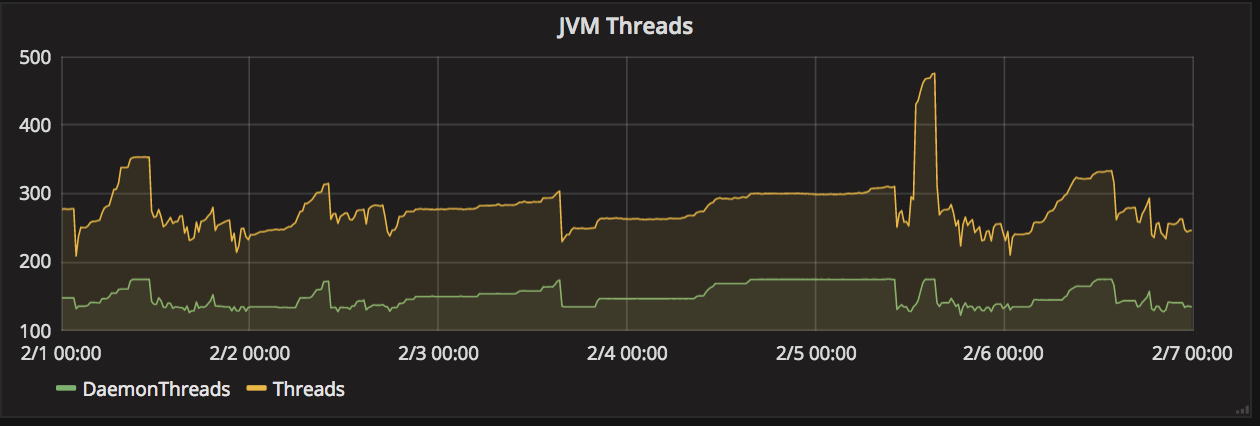
We then refined our hypothesis to focus on our service resources. If the services were resource constrained, then we would expect to see an increase in resource acquisition time during peak periods. We looked at thread and heap usage, and while we found increases during the outage period, the overall usage remained well below maximum capacity. Furthermore, garbage collection activity did not spike during this time, giving us additional confidence that the JVM heap and thread usages were not bottlenecks.

Looking at our network metrics, we were also able to rule out a constraint in the network between services and databases.
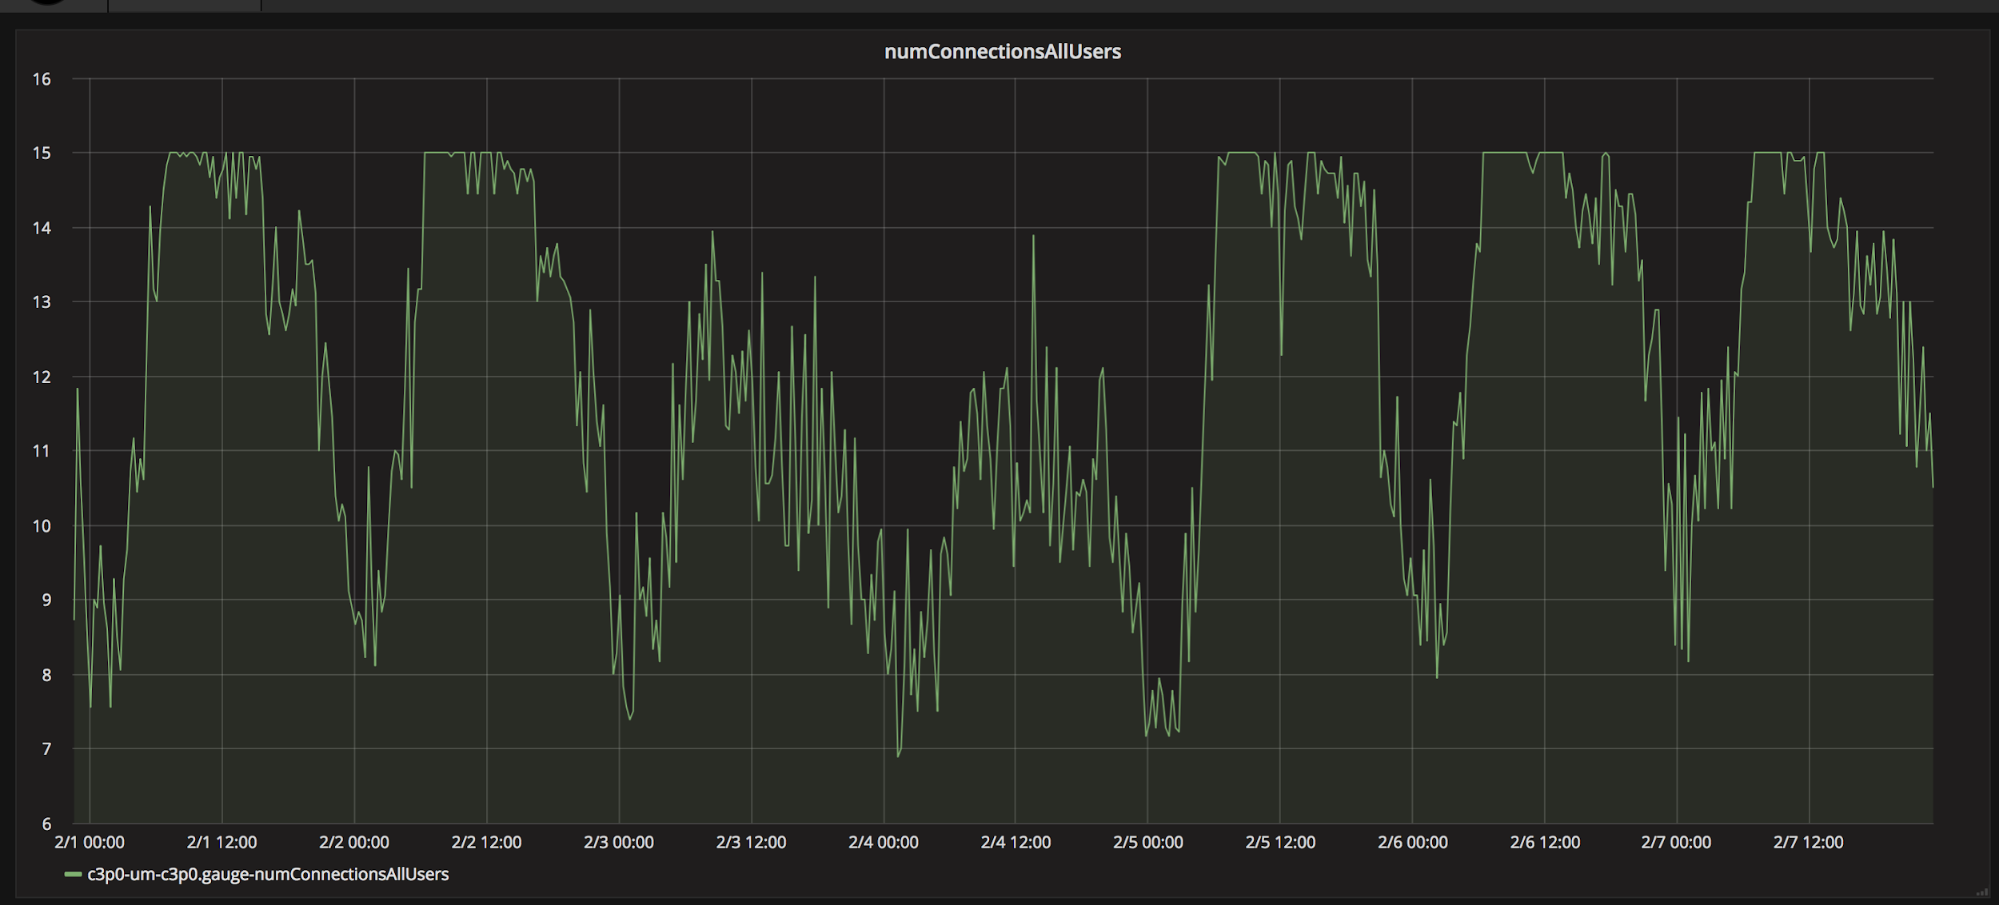
We then found a resource with an interesting pattern. From metrics on the size of the services’ database connection pools, we saw that the pools were regularly growing to near max capacity even during normal operational periods. Our bottleneck hypothesis became the following: if there was a spike in usage, then being unable to open more database connections would cause the extended connection pool fetch times we had been observing, which would eventually build up to an outage. This hypothesis fit with our other data points as well: the connection pool limit would prevent us from sending a large number of queries to the database, the waiting threads had low memory overhead, and the outage would occur before the thread pool size grew out of control.
However, we needed additional data in order to validate this hypothesis and move toward preventing future outages. Specifically, we needed to know:
- Would high connection pool usage definitely lead to unacceptably long connection pool waits?
- Assuming our hypothesis was upheld, why we were seeing consistently high concurrent database connections?
Making the Unknowns Known
The next step was to collect more metrics. We began logging the latency of all database transactions from our backend services and every connection pool fetch attempt that took longer than 5ms. We also used the MySQL slow query log to log every query that lasted longer than 10ms, and we used Percona’s pt-query-digest tool to parse that log.
We then used this raw data to compile higher level monitoring: we generated a report using the day’s data to simulate a 10x load on concurrent transactions. This allowed us to flag at what points throughout the day we would be over capacity due to threads pausing to wait for a database connection, under this simulated load. We thus gained further confidence that de-bottlenecking this resource would allow us to handle unexpected spikes in user activity and scale further! Below is a real before/after report for one service that reflects our scalability improvement efforts.

We continued the investigation by identifying root causes behind the high concurrent database connections. The data revealed the following root causes:
Slow Queries: There were several queries that seemed slower overall than they should be, given the expected amount of data they needed to read. This indicated that, at least in some cases, we were sending inefficient queries to the database.
Starved Services: The database connection pool limit exists to protect the database from being overloaded. However, we found that our services were reaching their maximum concurrent connection capacity without the database reaching its maximum resource constraints. This indicated that the current concurrent connection limit itself was a bottleneck.
Inconsistent Database Response: Many queries showed an erratic pattern of extremely high tail latencies that could not be reproduced on future attempts. This suggested an additional problem at the database level.
The key thing we learned from uncovering these patterns is that interactions between systems can be complex in surprising ways, and that having metrics around the higher-level functionality of a system is more valuable than metrics that report on each of that system’s low-level components. Each of the root causes we identified required its own analysis and led to multiple configuration, data, or code changes to improve performance and be prepared for 10x scale at any time. Stay tuned, because we will go in depth into each problem in its own blog post!
— Allison Hume and Kevin Shin, on behalf of the scalability engineering team
Love diving into the unknown? Check out our job openings!
Disclosure
This blog has been prepared solely for informational purposes only. Nothing in this material should be construed as tax advice, a solicitation or offer, or recommendation, to buy or sell any financial product. Wealthfront Software LLC (“Wealthfront”) offers a software-based financial advice engine that delivers automated financial planning tools to help users achieve better outcomes. Investment management services are provided by Wealthfront’s affiliate, Wealthfront Advisers LLC, an SEC registered investment adviser, and brokerage related products are provided by Wealthfront Brokerage LLC, a member of FINRA/SIPC. Wealthfront, Wealthfront Advisers LLC and Wealthfront Brokerage LLC are wholly owned subsidiaries of Wealthfront Corporation.