It’s here. Finally. Social-networking darling Facebook yesterday filed an epic initial public offering seeking to raise $5B with the company valued between $75B to $100B. The IPO prospectus (also known as “Form S-1”) filed with the SEC is a massive registration document describing the details of the offering, the company’s business model and preliminary financial results. But who has the time to read the lengthy document in details? I know you don’t. You probably don’t want to either, especially having read tons of news articles about it already. So I did some simple text analysis in R to visualize the prospectus such that you can take a quick peek.
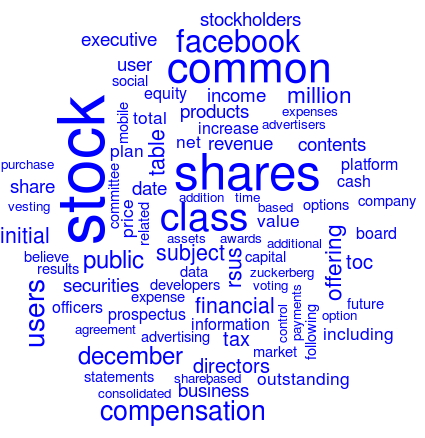
The following graph shows the word cloud of Facebook’s IPO prospectus, i.e. the most frequent words in the document. Not surprisingly, majority of the words are related to IPO: stock, class, shares, common, prospectus, stockholders, financial, initial, public, offering, capital, equity, and so on. The other words are related to Facebook’s business: mobile, advertisers, users, platform, social, data, awards and so on.
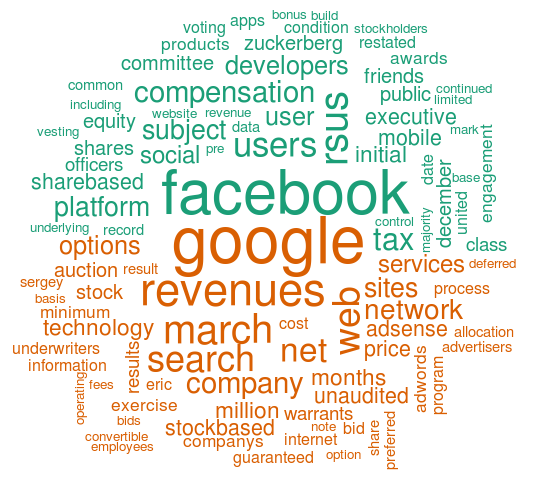
I’m actually more interested in what the prospectus tells about Facebook’s business, by somehow removing most IPO-related words. I choose Facebook’s archrival — Google. Even Facebook lists Google as its “significant competitor” in the prospectus. I compare Facebook’s prospectus with Google’s filed back in 2004, and plot the comparison word cloud between the two in the following graph. The top part of the graph shows the words that are frequent in Facebook’s prospectus but infrequent in Google’s; the bottom part shows the words that are frequent in Google’s but infrequent in Facebook’s. This exercise (hopefully) would remove most of the IPO-reated words because they are frequent in both documents, and focus more on the two companies’ businesses. Facebook-specific words are: facebook, social, users, friends, apps, mobile, platform, developers, engagement, etc. Google-specific words are: google, search, adsense, adwords, services, auction, technology, etc. Interestingly, company executives’ names show up in both documents: “mark” and “zuckerberg” for Facebook; “eric” and “sergey” for Google. Maybe even more interestingly, the word “revenues” appears very prominent in Google’s cloud.
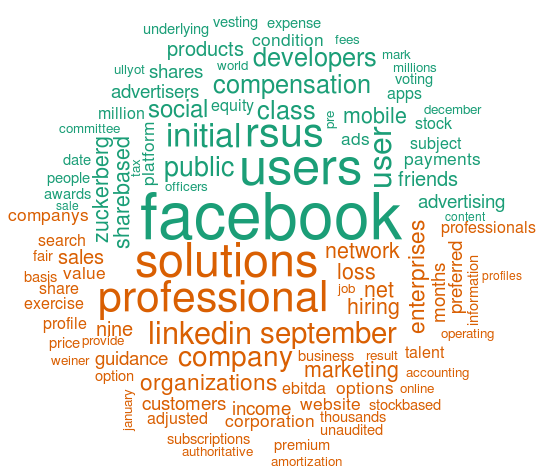
What about the other social-networking site LinkedIn? This graph shows the comparison between Facebook’s prospectus and LinkedIn’s filed last year. LinkedIn-specific words are: solutions, professional, linkedin, hiring, talent, profile, job, marketing, subscriptions, premium, etc. LinkedIn’s CEO “weiner” also shows up in the graph. The company name “linkedin” is much less prominent compared to “facebook” and “google”.
If you are interested doing similar analysis, here is how.
The prospectuses are downloaded from SEC’s website. Data links —
– Facebook’s S-1 (2012)
– LinkedIn’s S-1 (2011)
– Google’s S-1 (2004)
The “tm” and “wordcloud” packages in R are used to generate the graphs. The “tm” package in R is a text mining library. I use it to build a corpus by reading the prospectuses from text files, and perform the standard drills to pre-process text data, such as removing numbers, punctuations and stop words. I use the “wordcloud” package in R to plot the word cloud graphs, both the stand-alone graph and the comparison graph. Special thanks to the contributors of “tm” and “wordcloud”, which makes text analysis and visualization easy and fun. In the end I’m including some R code —
require(tm)

require(wordcloud)
# Build corpus and pre-process data
c = Corpus(DirSource(“/home/qian/Work/IPO_S1″), readerControl=list(language=”en”)) # put the prospectuses in the directory; build a corpus by reading the files
c = tm_map(c, removeNumbers) # remove numbers
c = tm_map(c, removePunctuation) # remove punctuations c = tm_map(c, removeWords, stopwords("en")) # remove stop words c = tm_map(c, tolower) # to lower case f = c[1] # facebook g = c[2] # google l = c[3] # linkedin # plot the facebook word cloud tdm = TermDocumentMatrix(f) m = as.matrix(tdm) freq = rowSums(m) words = rownames(m) wordcloud(words,freq,min.freq=100,col='blue') # plot the facebook-google comparison word cloud tdm = TermDocumentMatrix(c(f,g)) m = as.matrix(tdm) comparison.cloud(m,max.words=100)