I’m wrapping up my first couple of weeks at Wealthfront, and I’m very confident to say that I made the right decision for my last internship before graduation. On my first week, I was told “Now you know what it’s like to work at a hypergrowth startup company”. I couldn’t agree more with the sentiment, it has been an amazing time to be here, whether it was preparing for our recent announcement of reaching $1 billion in AUM to digging into research projects that might just impact how we reach our next $1 billion. Let me try and start from the beginning and describe my start as a Wealthfront quantitative research intern.
Working environment
The anticipation of joining a vibrant start-up began a month before my term with the introduction emails. Interns from across the nation gave their backgrounds and hobbies. I had never seen such a major energetic cohort with interests ranging from extreme hiking to music production and to ballroom dancing. On my first day, I was pleasantly surprised by the sophistication and breadth of the data and technology, coupled with documentations that are crowd-sourced and well-maintained. In addition, every intern was assigned a mentor to assist and supervise. Thanks to all the help that Wealthfront provides, I spent little time setting up and immediately jumped in on quantitative analysis using R. R provides a wide variety of statistical and graphical techniques and is the favorite programming tool for most statisticians. I was delighted to find that the Wealthfront research team has adopted R as the primary programming language for data visualization, data analysis and data modeling.
While my doctoral dissertation focuses heavily on R analysis, the pace and style of development here is on an entirely different level. Wealthfront is dedicated to being a data-driven company. Strategic decisions are made based on insights generated from data analysis and research. This is reflected in the company’s heavy emphasis on building an efficient and secured data platform, and maintaining and improving data quality. From the analysis side, all code is organized in functions and then R packages. Computationally extensive models are carefully designed and written in ReferenceClass. Rather than writing ad-hoc code, we write structured scripts to ensure our analysis is reproducible. And finally, everything is tested to ensure accuracy. All R functions and classes are coupled with tests.
First project
My first task was to analyze the spread of the Exchange Traded Funds (ETFs) Wealthfront invests in. Our investment team is led by the renowned economist Dr. Burton Malkiel, who famously stated in his bestselling book Random Walk Down Wall Street (soon to be released in its 11th edition) that for a long term investment horizon, the optimal strategy is to invest in a portfolio diversified across relatively uncorrelated asset classes, customized for individual risk tolerance. Following his investment philosophy, we invest in a widely diversified portfolio consisting of 11 asset classes. Each asset class is represented by a low-cost, passive ETF (investment whitepaper). Wealthfront simply charges a management fee of 0.25% for accounts over $10,000, and charges no trading commissions. My first project was to calculate and visualize our daily average buy and sell prices of our 2014 ETF trades. The difference between the buy and sell prices should reflect the ETFs’ spread and our execution quality. Wealthfront buys and sells ETFs at different time points during a day. What I analyzed was the “effective” spread that we paid or collected on average in our trades. As a start, I studied the spread for two major ETFs that we invest in: VTI and MUB. VTI is chosen to represent the asset class of US stocks; and MUB represents the asset class of municipal bonds.
The first step is to load real-time trading data into R. Our data is stored in a unified cloud data warehouse (DWH), which has fast query performance and handles large-scale data. Perhaps not surprisingly (since we are a technology company), our day-to-day operations generate large amount of data. Our data engineers do a very good job delivering and maintaining high quality data. Thanks to their work, there is a large series of well-formatted and well-cleaned data tables available for various research purposes. To make things even better, Wealthfront has developed its own R function to load data directly from the DWH by calling a simple string of SQL queries. For the spread analysis, all I had to do was the following:
where 8897 is the instrument ID of VTI. The output of function ExecuteSqlQuery is a data frame. In this study, data is a data frame with columns date, time, quantity, price, fee and action for each trade that we’ve made since the beginning of this year, ordered chronologically by the time trades occurred.
With the data frame ready, for each ETF at each trading day, I calculated:
where represents the number of sales made during that day. Similarly for purchases, I calculated:
where represents the number of purchases made on each specific day. And the corresponding daily spread for this particular ETF is calculated as:
In R, this can be quickly done by just a few lines of code. Suppose we need to calculate the effective spread on day i:
I wrote a function to iterate through all the trading days for this year and the final result is a vector of spreads.
Lastly, all code comes with tests. To test my function, named as CalcAvg, I wrote the following test:
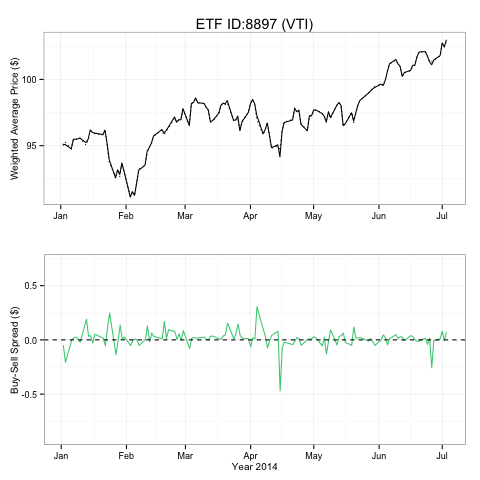
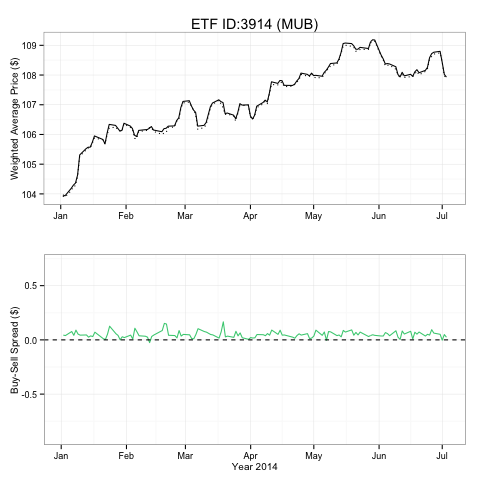
Results for VTI and MUB are presented below. In the first two graphs, the upper plot shows daily time series for Average Sell Price (dashed line) and Average Buy Price (solid line); the lower plot shows daily time series for Spread. The graphs are written in R using package ggplot2:
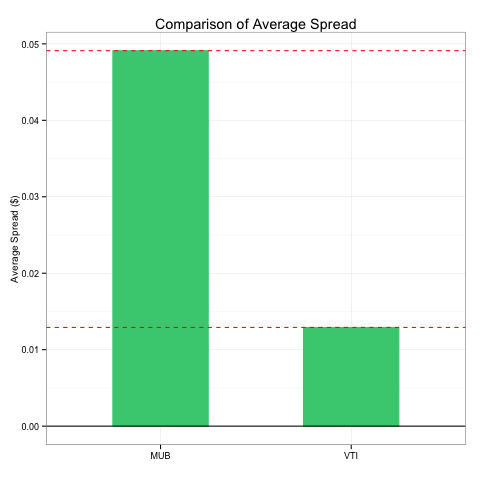
The third and last graph provides a quick comparison of average spread between VTI and MUB since January 1, 2014. We can see that in general, VTI has a much tighter spread than MUB; and the average spread for both ETFs are positive. This plot is also made in R with ggplot2:
Final thoughts
I come from an academic environment, where our research may not always be as applicable to real-world situations. Before arriving, I listened to academic heavyweights such as Dr. Burton Malkiel vouching for Wealthfront’s philosophy and I was delighted in the first week to find articles from scientific journals as relevant readings. After I finished my first project, I moved on to use various statistical research methods involving stepwise regression, LASSO regression, random forests classification/regression and other machine learning methods to provide in-depth insights about Wealthfront’s clients. It’s exciting to bring the depth of fundamental research together with the rubber-meets-the-road approach favored by Silicon Valley firms such as Wealthfront.
While it’s the work and research that most interests me, Wealthfront has practiced a rapid iteration approach and expanded my capabilities. From participating in team softball games to long-term strategy meetings, in the short time I’ve been here I’ve already had a wide range of experiences that have enhanced my skill-set and allow me to view things from a much different perspective. My first few weeks have been fantastic. I’m excited to take the latest statistical theory from academia and apply it to real-world problem-solving that will benefit Wealthfront’s clients.


