Continuous deployment is the unification a number of best practices to create a more iterative and responsive engineering organization. Frequent, small commits reduce merge conflicts and help engineers adapt to changes in other parts of the code more quickly. Thorough automated testing ensures confidence in the codebase and allows engineers to make changes without worrying that another part of the system will fall down. It yields fast feedback to developers and gives confidence to management that the product will be stable. Testing is the workhorse of continuous deployment. We’re committed to writing great code at Wealthfront, and our testing infrastructure is the biggest part of delivering on that commitment.
However, in talking with friends about continuous deployment, many seem interested in deployment infrastructure. When we say that we push new code as often as every few minutes, they ask, “How is it at all feasible to restart your services that frequently? If you’re deploying code all the time, how do you have time to actually write code?” I’d like to take a little time to walk through our deployment infrastructure, and describe how we’re able to do this.
I need to provide some context. Wealthfront uses a service oriented architecture, where each service is clustered and dynamically discovered (using ZooKeeper). Continuous deployment ends up looking to services like tiny failures and recoveries happening all the time. Because our clusters are designed from the bottom up to handle failure and work around it gracefully, continuous deployment has no effect on our underlying stability. With that said, it’s time to take a look at what happens after a piece of code is committed.
First a hook in our revision control system kicks off a build in our continuous integration server. This runs through all our tests and alerts us if something fails (more on how seriously we take alerting build failures in another post). Our tests currently take about three minutes to run.
Second, the engineer who committed the code decides to deploy it, loads our deployment manager to begin the automated process and clicks the release button next to the cluster they want to deploy. Here’s what the page looks like (in this case the deployment manager is deploying a Portfolio Manager, or PM, cluster):

A brief orientation is required. The list of active deployments is in the top left, with the service, revision and current state of the deployment. Our Deployment Manager has a release queue that allows 2 concurrent releases, though we’ll scale that up as needed. When this screen shot was taken, the PM release underway was for revision 25978 and it was building the release package.
Under the list of active deployments is our cluster status. This allows us to briefly look at the state of our system, notice any problems and break out to dedicated monitoring tools like nagios and collectd if we need to. If there was a problem on the system, the service instance would be highlighted in yellow or red depending on the severity of the issue.
The right column contains our current hudson status (pulled using hudson’s great apis). The revisions are helpfully linked to a web subversion interface. Under the hudson status is a list of recent commits, each showing the result of the build for that commit and a small ‘X’ that allows the instant rollback of the commit if it’s breaking the build.
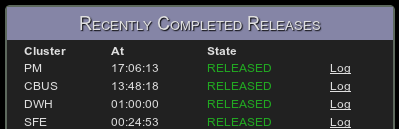
Finally the last box in the right column shows recently completed releases (the screenshot is from a Sunday night, which is why it’s so quiet).
Now back to the deployment of the PM cluster. The Deployment Manager rolls out code incrementally, picking one service first, monitoring it for a bit, and then exponentially increasing the size of the batches it deploys while monitoring the health of each individual service instance. Here’s what the Deployment Manager looks like after deploying the first service, during it’s burn in time:
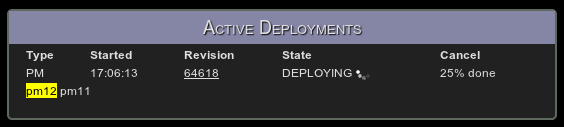
Each service starts, initializes itself, announces that it’s coming up to other services, runs a quick self test to verify it’s working properly, and then re-announces itself with the results of the self test. If the service is happy with the self test, it will begin serving traffic, if it’s not, it will describe itself as failed (allowing other services to avoid talking to it) and the Deployment Manager will initiate a rollback to the last known good revision (which takes about five seconds to complete across a cluster of 10 machines).
During the rollout the Deployment Manager is also monitoring the service instances itself and checking with other monitoring tools to verify that the system as a whole is happy with the service. The self tests are useful for catching misconfiguration issues with the service, but what’s ultimately important is if the service is playing nicely with others.
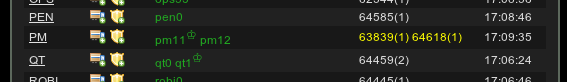
Here’s the second PM being deployed:

And here’s what it looks like in the Cluster Status box at the same time:
Finally the release is complete (in total it took about 4 minutes, or 7 minutes from the initial commit) and the record is moved to the recently completed releases log:
The Deployment Manager started out as a quick weekend project, but has become a useful part of our engineering processes. Beyond making service deployment more efficient and allowing us to react to errors at lightning speed, it also allows us to keep detailed records of deployments. This is incredibly useful when we’re looking at a blip in a monitoring graph. We can correlate the blip to a commit immediately, which helps diagnosing and fixing the problem quickly.
As I said before, deployment tooling is far from the most important piece of infrastructure to successfully execute continuous deployment, but it is useful and makes us more efficient.