Ever been here before? Stuck with a job that needs to be continually revisited because its performance gets worse with every passing day, and each attempt at improving said performance yields diminishing returns? This is the situation we found ourselves in with the portfolio balance calculation system—the code responsible for aggregating data from multiple sources in order to display the daily market value, net deposits, portfolio performance, and several other metrics on the dashboard. This system is also one of the oldest at Wealthfront and doesn’t follow our current best practices and style, consequently making it more difficult to modify than more recently written code. As a result of that, as well as its status as an overnight batch job, we’ve only periodically invested in improving the performance, which can be seen in the run time drops in the chart above.
However, by early 2024 it became clear that the job scaled too poorly to continue this pattern of incremental improvements due to continued client growth and growth in assets under management. By this point we had already increased parallelism to utilize most of the service’s database connections, so simply scaling up was becoming less viable. As such, we decided to investigate the performance of this job more thoroughly and come up with a solution that would be more sustainable.
Finding the Problem
When investigating performance issues, it’s always good to start by collecting data. This ensures that we spend our time improving the right things. Thankfully, at Wealthfront we already have some pretty great tooling for doing so.
$ qc biw Help CollectAndRenderProfileSvg
CollectAndRenderProfileSvg(
    @Param(QUERY, BATCH_QUEUE, or POOL) Kind kind,
    @NoConcurrentExecution @Param(queue name, query name, session id, or thread pool prefix) String identifier,
    @Param(stop recording after this many seconds) int stopNumSeconds,
    @Optional(11) @Param(number of samples to record per second) double samplesPerSecond,
    @Optional(0) @Param(negative value to disable) int stopWhenAllWorkersIdleFor,
    @Optional(0.1) @Param(disable further analysis of traces with less than given % of parent traces) Scalar filterThreshold
): String
Code language: Bash (bash)
Qc is a command line query client, where invocations take the following form: qc <service> <query> <arguments…>. CollectAndRenderProfileSvg is a sampling profiler that can locate the threads associated with a requested task and repeatedly take stack traces, aggregating the results to be interpreted later. Once an exit criterion is met (as defined by stopNumSeconds or stopWhenAllWorkersIdleFor), the collected data is converted into the format that inferno expects and rendered into a flame graph.
$ qc biw CollectAndRenderProfileSvg QUERY RunAllCalculatePortfolioBalances > RunAllCalculatePortfolioBalances.svg
Code language: Bash (bash)
The following was recorded while calculating the daily portfolio balance for a particularly large account.
Flame graphs are a visual representation of what proportion of time is spent in any given function, with nested function calls represented by the next layer in the graph. For example, since the bottommost element is 100% of the width of the graph, we spend 100% of the run time in RunAllCalculatePortfolioBalances.process. You can hover over elements to get more information, including the number of stack traces that included that function, the percentage of total time spent in that function, and the fully qualified name of the function. You can click on elements to focus them, expanding the X-axis to only include the section of the graph related to that element. This allows you to quickly answer questions like “why does function X take 25% of the run time?”
Unfortunately, this result does not suggest any easily fixable issues like a database query missing an index or a CPU-intensive section of code. However, using the search function of the flame graph reveals something interesting.
Searching for “poll(” reveals that we are spending a large majority of the time in Net.poll, and further investigation shows that these are mostly caused by database transactions. None are particularly noteworthy, but what is noteworthy is that there are so many of them.
Keen-eyed readers may have noticed that this flame graph is based on 1,519 samples. At a sampling rate of 11 per second, this means that we spent over two minutes calculating the balance for a single account. This seemed unreasonable, but the real shock came when we saw that on the day in question, the account had only four transactions. (Yikes!)
Back to First Principles
Something could clearly be improved here. At a conceptual level, balance calculation requires the following data:
- End of day positions for each security
- Prices for held securities
- End of day cash balance
- Transactions that occurred during that day
- Yesterday’s balance
Even for a large account, this is a minuscule data set. Every related table has the relevant indexes and can be retrieved in milliseconds. Yet, somehow we are spending over two minutes for a single account—ten hours for all accounts. This result is only explainable if our approach is fundamentally mismatched with the underlying data. I confirmed this experimentally by fetching all of the required data for all accounts, which took five minutes. To investigate further, I would need to look at the code with a fresh set of eyes and really think about what we were doing.
A Representative Example
Digging around the code, I frequently saw parts that looked like this.
portfolio.trades()
    .stream()
    .filter(trade -> trade instanceof Fee)
    .max(Comparators.comparing(Trade::date));
Code language: Java (java)
This is a very natural way of finding the most recent fee transaction in a given portfolio, but some of you might already see the problem. Trade and Portfolio are Hibernate entities, or in-memory representations of database records and relationships. The problem stems from the latter fact—Portfolio.trades represents the relationship between trades and their portfolio as a Java Collection. This collection is lazily loaded, meaning the entities are queried from the database dynamically as you iterate through the collection.
Let’s say these entities are backed by the following tables:
CREATE TABLE portfolio
(
    id BIGINT AUTO_INCREMENT PRIMARY KEY
);

CREATE TABLE trades
(
    id           BIGINT AUTO_INCREMENT PRIMARY KEY,
    portfolio_id BIGINT         NOT NULL,
    type         VARCHAR(255)   NOT NULL,
    date         DATETIME       NOT NULL,
    quantity     DECIMAL(20, 5) NOT NULL,
    CONSTRAINT fk_trades_portfolio_id
        FOREIGN KEY (portfolio_id) REFERENCES portfolios (id)
);

CREATE INDEX trades_portfolio_type_date
    ON trades (portfolio_id, type, date);
Code language: SQL (Structured Query Language) (sql)
Can you see the problem? In this example, we must load every trade in the portfolio’s history to find the most recent fee. This is quite wasteful. We constantly load data into memory that will never be read (everything but the type of trade and the date), and what’s more, we do not utilize the index trades_portfolio_type_date to efficiently select exactly the row we care about. If instead we had written the most natural SQL, we would hit an index and only load a single row!
SELECT id
FROM trades
WHERE portfolio_id = :portfolio_id
  AND type = 'fee'
ORDER BY date DESC
LIMIT 1;
Code language: SQL (Structured Query Language) (sql)
This is a classic example of the N+1 query problem in disguise, where iterating over a collection triggers a cascade of individual database queries instead of one efficient, targeted one. This is the sort of systematic issue that can result in orders of magnitude worse performance than is reasonably achievable.
An Inflexible Choice of Architecture
Unfortunately, there is no quick fix for this problem. This particular functionality is exclusively written in terms of Hibernate objects and methods on Hibernate objects, so there is no clean place to break away from this style of implementation and insert some SQL. Not only does every method take in and return Hibernate objects, but there is no dependency injection either, so fishing a reference to the database session down to the places it is needed would involve changing the signatures of dozens, if not hundreds, of methods.
This ties back to the fact that this is a very old system, originally implemented in 2010 before Wealthfront had developed best practices of separating state from business logic and using dependency injection to wire up the application. The superiority of the new style is quite evident in this case—had portfolio balance calculation been written in this way, we could inject the database session at any point and write SQL to fetch required data without refactoring the entire system.
However, the system was not implemented this way and, furthermore, passes Hibernate objects up and down the stack extensively, making their removal impractical. As such, I believe that relying on methods within ORM objects to contain complex business logic was the wrong architectural choice for this kind of data processing.
The Fix and the Payoff
Armed with this understanding, we undertook a full rewrite of the system using our modern architectural patterns. Worth noting, this option was only reasonable because this system was relatively isolated, so the effort required to migrate existing usages to the new system was not too steep. In any case the rewrite went smoothly, and the difference in approach immediately became apparent.
Excluding the skewed results caused by outliers in November and December, we can see the new approach takes roughly a tenth of the time the old process took to perform the same work. Due to the more efficient use of resources, we were able to increase concurrency beyond what the database could handle with the old approach. Most encouragingly, the job now scales efficiently with the resources it is provided. At this point I would be satisfied to throw more hardware at the problem should it become necessary, as the solution is no longer wasteful with the resources it is allocated.
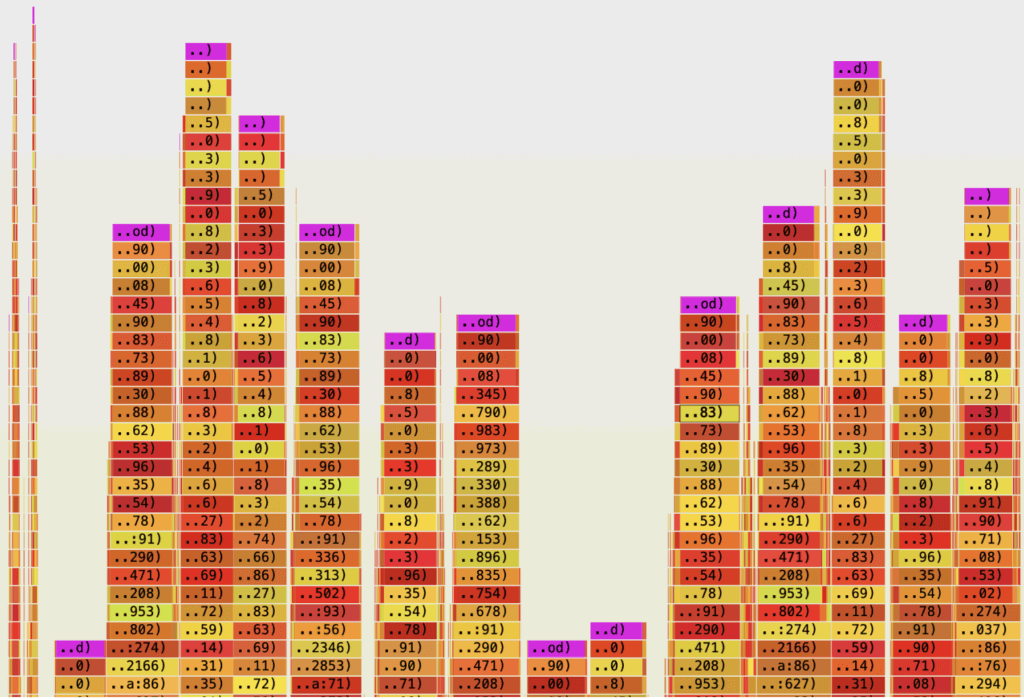
For those that are curious here’s a flame graph for the new implementation, this time taken in production while calculating portfolio balances for all accounts.
This entire experience has been a validation of our newer approach to implementing systems, as this rewrite would not have been necessary had dependency injection and sparse use of ORM objects been the style. This is the only system that I am aware of that has necessitated a complete rewrite. With over 8 million lines (and counting) of backend code, this is a pretty excellent track record. So while this might not be the last system that we outgrow as we continue to scale, I am confident that incremental improvements will be the solution more often than not. This just goes to show that something as seemingly innocuous as code style, where it has architectural implications, can result in an order of magnitude difference in performance and scalability.
Disclosures
The information contained in this communication is provided for general informational purposes only, and should not be construed as investment or tax advice. Nothing in this communication should be construed as a solicitation or offer, or recommendation, to buy or sell any security.
Any links provided to other server sites are offered as a matter of convenience and are not intended to imply that Wealthfront Corporation or its affiliates endorses, sponsors, promotes and/or is affiliated with the owners of or participants in those sites, or endorses any information contained on those sites, unless expressly stated otherwise.
Investment advisory services are provided by Wealthfront Advisers LLC, an SEC-registered investment adviser. Brokerage services are provided by Wealthfront Brokerage LLC, Member FINRA/SIPC. Financial planning tools are provided by Wealthfront Software LLC.
All investing involves risk, including the possible loss of money you invest, and past performance does not guarantee success. Please see our Full Disclosure for important details.
Wealthfront Advisers LLC, Wealthfront Brokerage LLC, and Wealthfront Software LLC are wholly owned subsidiaries of Wealthfront Corporation.
© 2025 Wealthfront Corporation. All rights reserved.