Here at Wealthfront we have many offline computations running in Spark. In some cases, small changes have caused a job to slow down dramatically, and other times, the size of the input may be growing and causing the job runtime to quickly increase. We normally check pipeline runtimes manually to make sure jobs are running quickly, but this isn’t a very scalable or reliable process.
A more automated long-term solution would be to create notifications when job’s runtime increases by more than 20% over a month. At Wealthfront we take monitoring seriously but in this case, none of our existing systems seemed capable of this type of monitoring. One such system is our exception tracker, but exceptions would be an inappropriate way to notify engineers of increasing job runtimes. We also have data integrity checks on the data in our offline analytical database, but this system is designed for sanity checks and only supports simple assertions. There are many examples of information we want to monitor such as page load time and market value of accounts. This need to monitor trends & metrics, rather than just binary success conditions, is a recurring pattern.
The real value of this project doesn’t just come from monitoring pipelines, though. This new intelligent metrics monitoring system will allow engineers at Wealthfront to add trend monitoring around arbitrary metrics, including business metrics. As our business grows, so does the number of metrics that indicate the health of our growth, execution and operations. This new system will also allow flexible alerting across all of these domains, from the number of website visitors to the number of trades we perform for our clients. This new system will also allow flexible monitoring across all of these domains, from the number of website visitors to the number of trades we perform for our clients. For the sake of this blog post though, we’ll focus on how just this motivating example of data runtimes.
Goals
In the case of our data pipeline runtimes increasing, we’ll want to take a look and help fix the issue, but it’s not immediately urgent. In contrast, another use case we have is monitoring page load times of our website. If the page load time increases dramatically, we do need to immediately fix that. Thus there are two kinds of information to monitor: issues that need to be fixed immediately and information that people want to know but is not an immediate problem. As a result, we designed the system to have two kinds of checks: alerts and reports. Alerts are designed for issues that need to be fixed immediately and when their checks fail, they page the engineers who are responsible for the checks through Wealthfront’s paging system. Reports are designed for information that people want to know but is not an immediate problem; when there is information to report, a daily email report will be sent to the appropriate recipients.
The need to monitor trends and metrics isn’t unique to pipeline runtimes, so of course another important goal of this project is to allow all Wealthfront engineers to write checks for their own projects. We want to design this system in a way that’s easy to use, but also allows engineers to do difficult things like trend monitoring.
We repeatedly saw a need for a system which would satisfy all the following goals:
- Making it accessible and extensible so that all engineers can write their own monitoring.
- Enabling higher level computation like trend monitoring via regression and modeling.
- Alerting urgent, immediately actionable issues (e.g., we’d want to know if we’ve introduced a change that made pages load significantly slower)
- Reporting information that is not immediately actionable (e.g. the runtime of a certain EMR job has increased by more than 20%) and not causing any actual problem yet.
Solution
Overview
We provide an extensible API for querying our analytical database and helper methods to perform common analyses on the data such as regression.
Here’s how we’d check for a data pipeline which has a runtime increase of more than 20% over a month. We use the @Test annotation to notify the system that it is a method to run, we use @Report and @Alert annotations to differentiate between reports and alerts. A method annotated with @Test and @Report:
Note that in this code example, the team to send the report to is captured in the reportName field of the @Report annotation
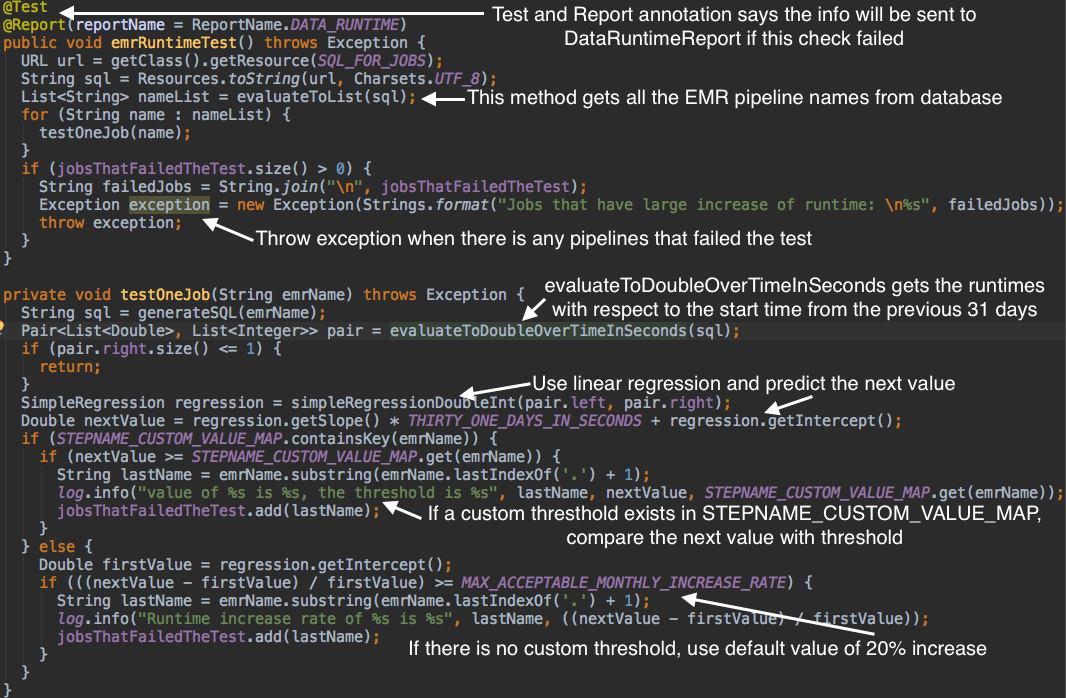
This check consists of two queries. We first generate a list of all our offline pipelines by using the List<String> evaluateToList(String sqlQuery) method to run a query which returns all the names. Then, we run a query for each individual job using the helper method void testOneJob(String emrName). In this helper method, Pair<List<Double>, List<Integer>> evaluateToTwoDoubleOverTimeInSeconds(String sql) method is used to return a pair of two lists, one for the runtime and one for the start time in seconds. We use a linear regression, and based on the results, test for 20% increase. Any flagged jobs are put in a list to be reported.
Implementation
Behind the scenes, there’s a lot of work to automatically find checks, run them, retrieve data, and correctly deal with any failed checks. Thus we created many Java classes to implement these functions.
MetricsMonitoringBase is a class that contains all the necessary methods to query our database and return data. To create new checks, user will extend the MetricsMonitoringBase class and write methods (one for each check) annotated with either @Alert or @Report. One method typically contains a sql query to get data from a Redshift database and some logic to analyze the data. Regression, which wraps Apache Common’s Math library, is provided as a helper method to help users analyze data.
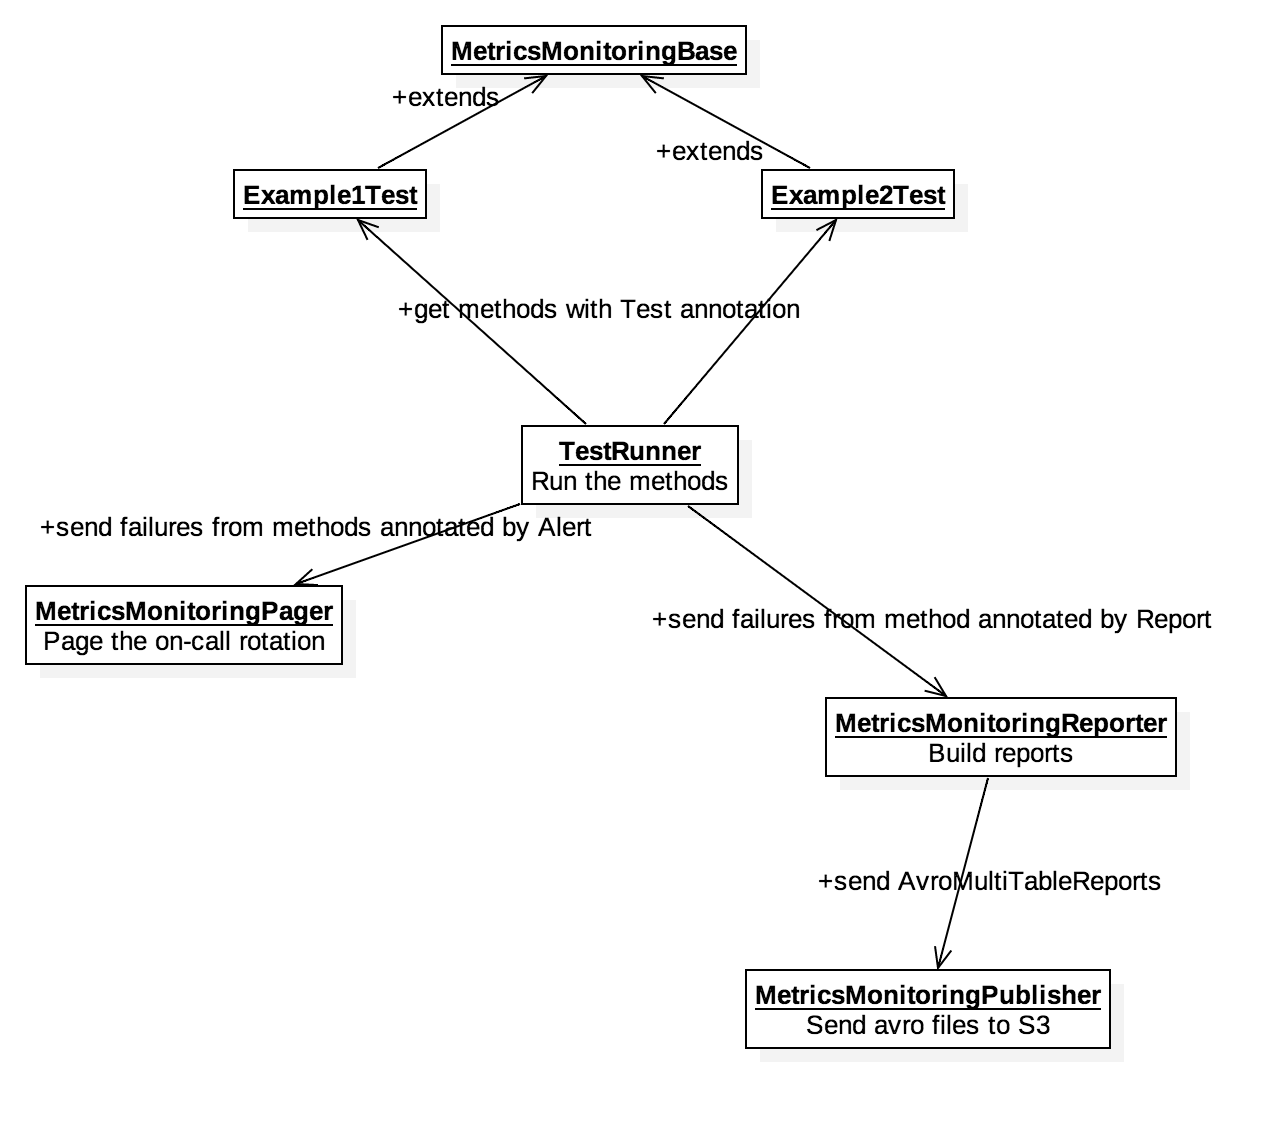
The logic for finding, collecting and running individual checks is handled by TestRunner, the main method for Metrics Monitoring system. Using reflection, it collects all the classes that extend MetricMonitoringBase and runs all methods annotated with @Test, in JMock style. It will pass the failures to MetricsMonitoringReporter if the method has Report annotation or MetricsMonitoringPager if the method has Alert annotation. MetricsMonitoringReporter groups the failures by report name, then builds and sends the reports for temporary storage in S3, where a separate service will find and send the reports to the appropriate recipients via email.
Production
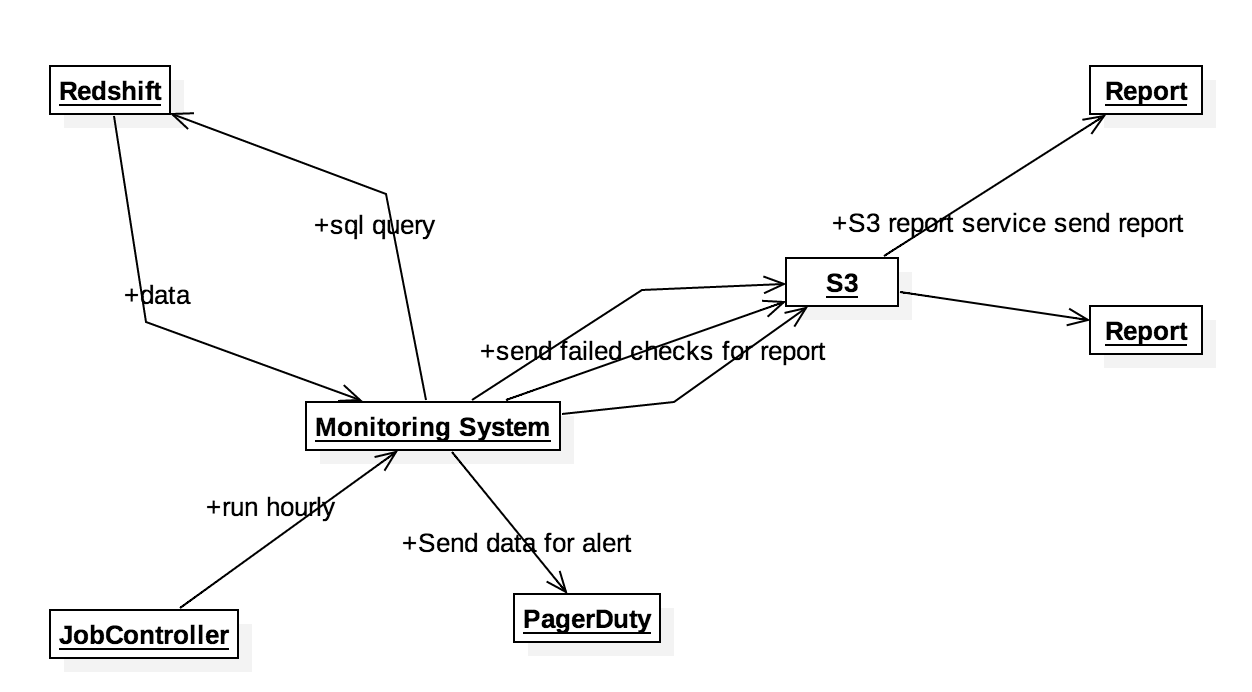
The metrics monitoring system is scheduled to run every hour in our JobScheduler. Alerts will be sent whenever a check with the Alert annotation fails because they are urgent and require immediate action. Reports will be sent once a day in the morning because the information in reports represents data trends are are going wrong but not causing any trouble yet.
In conclusion, by using the intelligent metrics monitoring system, we can easily write checks to monitor trends and metrics and send the failure information to engineers.