At Wealthfront, a significant portion of our backend applications are written in Java. The Java Virtual Machine (JVM) uses Garbage Collection (GC) for memory management, this forces us to pay close attention to its characteristics and behavior.
Every JVM service we run accumulates JVM and application-level statistics, spools these metrics into a
statsd server, and grants us the ability to query and visualize metrics via
grafana. In general, between collecting long-term metrics and on-demand heapdumps, we should be able to identify the vast majority of memory issues.
Issue Identification
We recently saw an abrupt spike in Out Of Memory (OOM) issues with one of our services, and after the second occurrence it was time to identify the root cause. Inside of grafana we could see a pretty clear behavioral memory issue over time.
Note: The
red arrows represent OOM behavior; while the
yellow arrows represent us collecting heapdumps over a period and debugging.
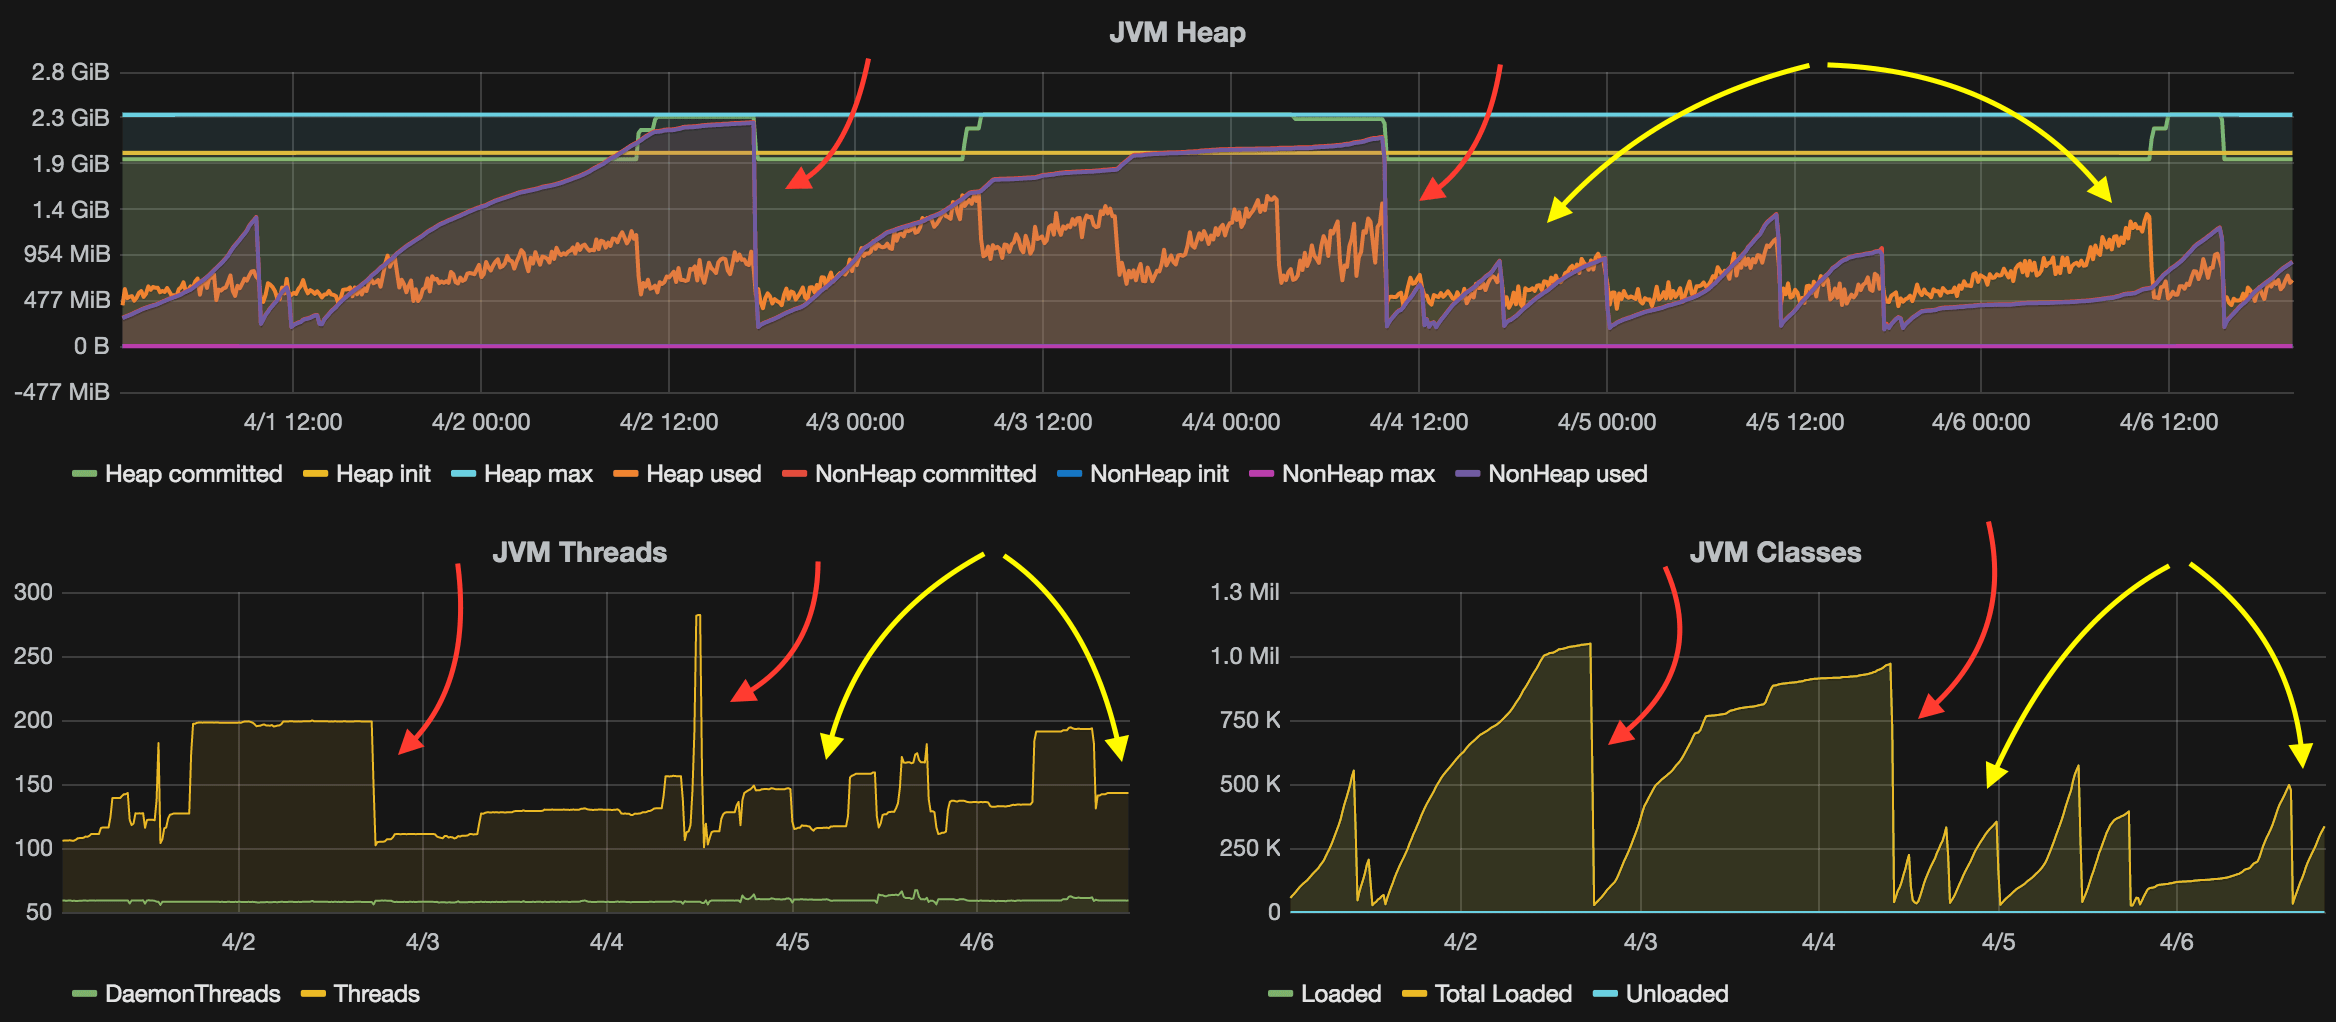
What we see here is that we have a forever-growing non-heap allocation, which seems to be directly related to the number of JVM classes. Additionally, 1M+ classes is a staggering amount and definitely displays unusual activity.
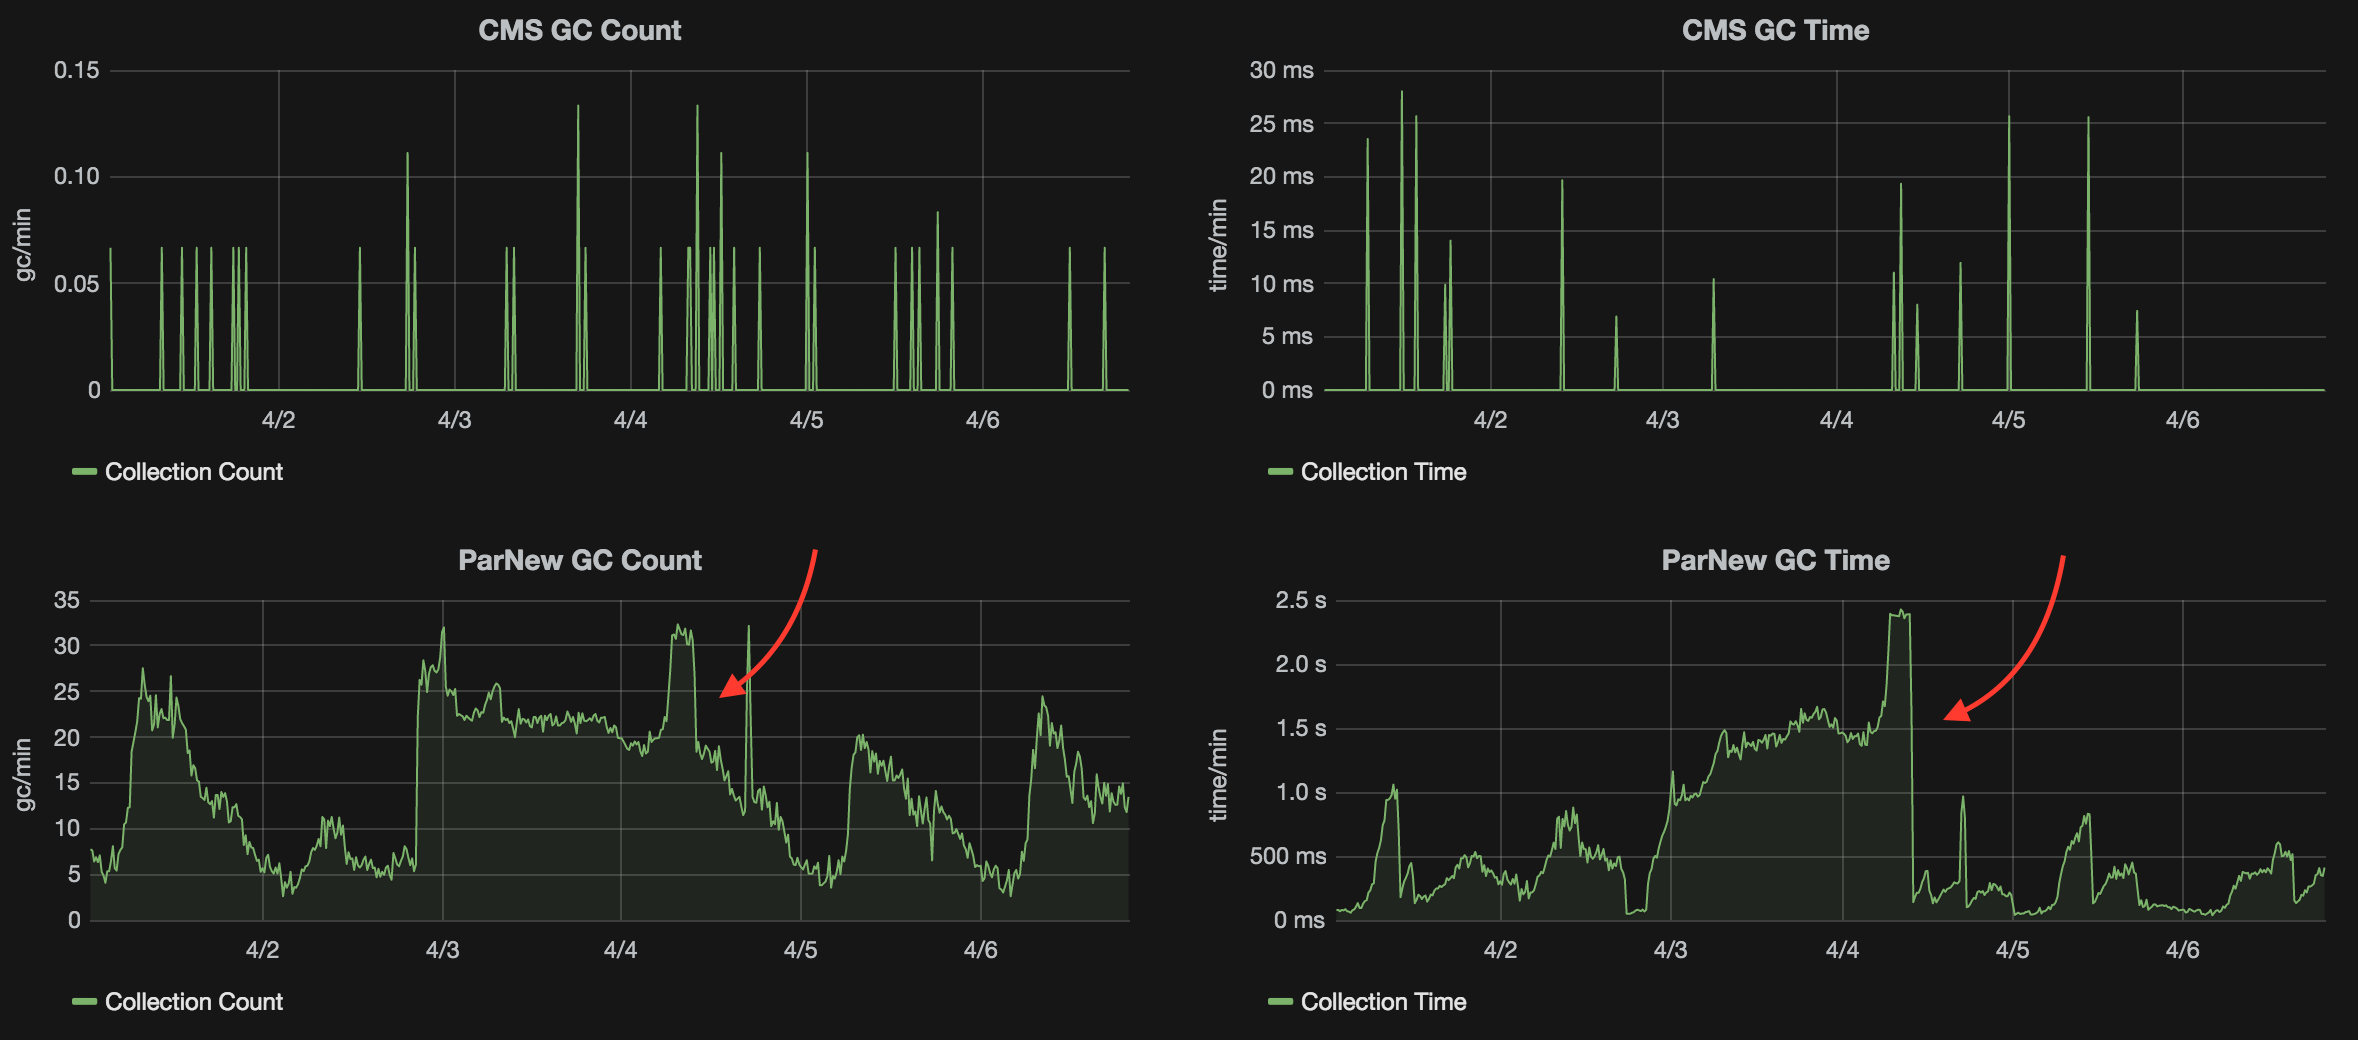
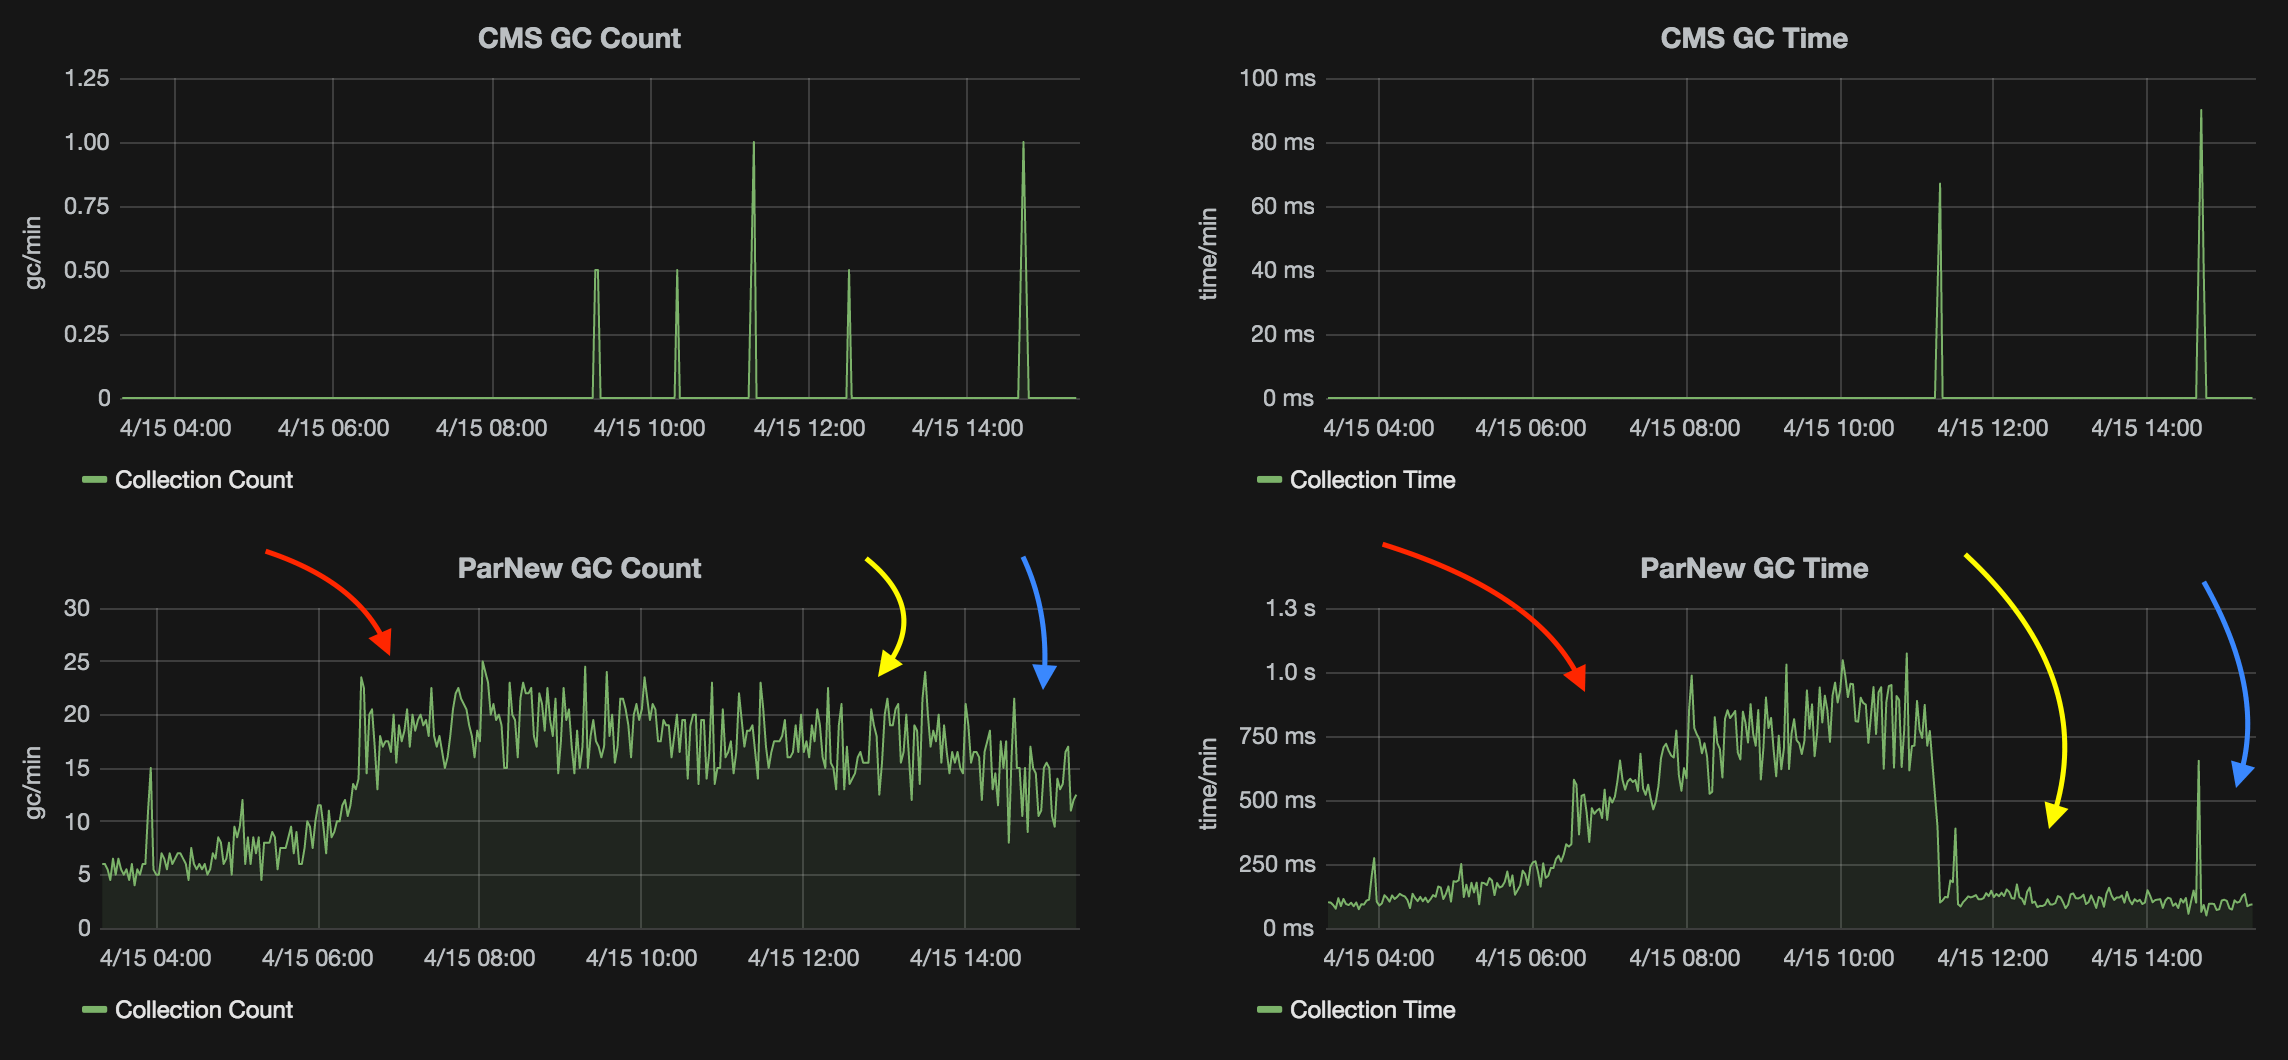
Associated with the larger heap (and growth in class count), we also observed that our CMS and ParNew Collections were growing out of hand. You can see above, the ParNew GC Time directly correlates with the number of JVM classes, the growth of Heap, and the forever growing Non-Heap allocations. In general, the more classes we have the larger the
NonHeap Used and
Heap Used (pointers to the off-heap allocations), and the more expensive our GC’s will become. Due to both the constant growth of both NonHeap and Heap sizes and our inability to GC classes, the problem exacerbates itself over time. We could potentially add
CMSClassUnloadingEnabled but we decided against this since it forces us to incur a performance penalty and it masks the core issue we should be resolving.
Root Cause Analysis
After identifying our memory issue, we needed to capture examples of the behavior so we could find out which Classes were the source of the leaks. We used a combination of both
jmap to collect the heapdumps themselves and
MAT to analyze what the root of these allocations and where they were taking place.
Heapdumps
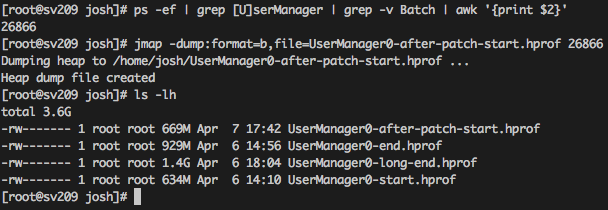
The application in question is called UserManager; the service happens to be running on a machine with another similarly named service, BatchUserManager. Before we can use jmap, we have to get the pid of the service and run jmap against it.
Using MAT
Eclipse’s Memory Analyzer is a pretty slick tool; when you download and open one of your heapdumps you’ll see a combination of panels.
The default view is a pie chart of the
Biggest Objects by Retained Size, this is normally useful if you have a single or a only a few objects leaking.

We’ve put all three of the default views beside each other to visually show the growth over time. From left to right the views are at initial load, 45 minutes later, and 3 hours later, respectively.
At application startup nothing stands out as particularly odd, at this point we couldn’t definitively identify good from bad. Although, it’s clear that there are many objects/classes which are smaller than 4.2MB of retained size. At the 45 minute mark, it appears the heap continues to grow without bounds, but we are not yet sure of the culprit. Finally at 3 hours, although we cannot yet identify the specific issue yet, it’s clear that this leak is a match to what we are seeing in grafana.
In addition to the retained size pie chart, there are also a number of actions you can run against your heap as shown below.

Each of these are pretty useful by themselves. Typically we’ll walk these items in the following order:
- Dominator Tree (Biggest Objects)
- Top Consumers (Most Expensive Objects)
- Histogram (Number of instances per class)
- Duplicate Classes (Multiple class loaders)
Dominator Tree
From past experience, the
dominator tree is usually where we’ll identify the largest number of
On-Heap issues. Come to find out, the tree wasn’t particularly helpful in our scenario (reflected classes) with unreachable GC roots.
You’re likely to have either one large object or a number of large objects which are exhibiting the same behavior. You can identify these types of errors, as well as trace them back to their initial code paths, by right clicking on a particular item and selecting the
GC roots option; usually 3-5 depth should be enough to show the base of the issue.
We were originally under the impression that the class leak would show up here and we’d be able to quickly identify the root function, however, this appears to not be the case for us.
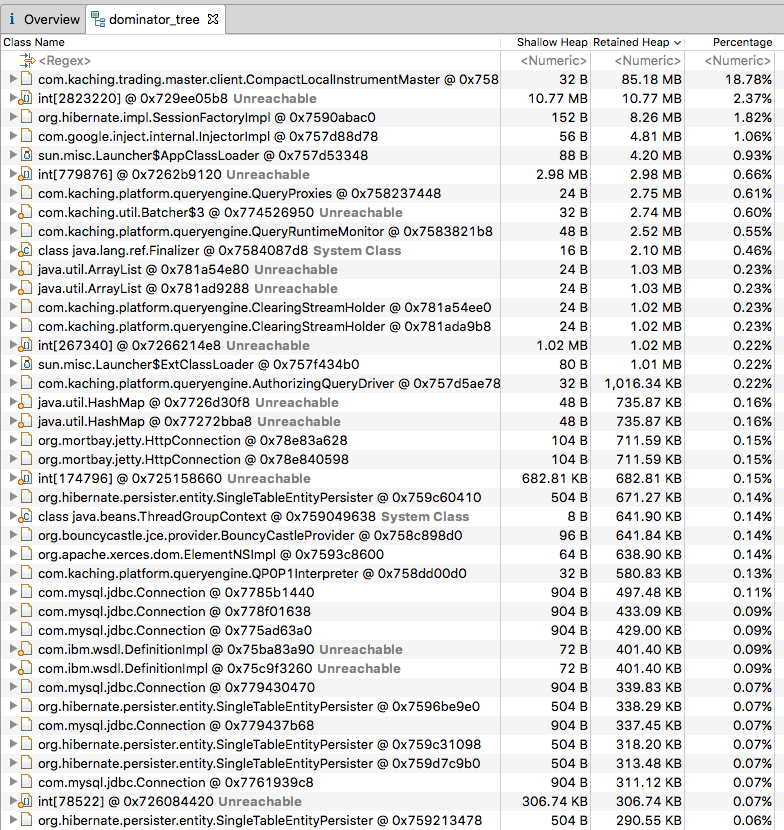
Above is our
dominator tree sorted by Retained Heap. As you can see the objects here aren’t alarmingly large, and it doesn’t appear to explain the 1G+ Off-Heap allocations we’re seeing. This was a bit of a surprise to us but we’ll soon explain where the leak was found.
Top Consumers
The
top consumers view has information-rich pie charts and lists similar to the default view. The charts include
biggest objects,
biggest top-level dominator classes,
biggest top-level dominator class loaders, and
biggest top-level dominator packages.
Histogram
The histogram provides a full list of all classes, the number of objects per class, and their
retained and
shallow heap sizes. The
shallow sizes represent just the data structures size, while the
retained heap represents a node and all of it’s children and held references.
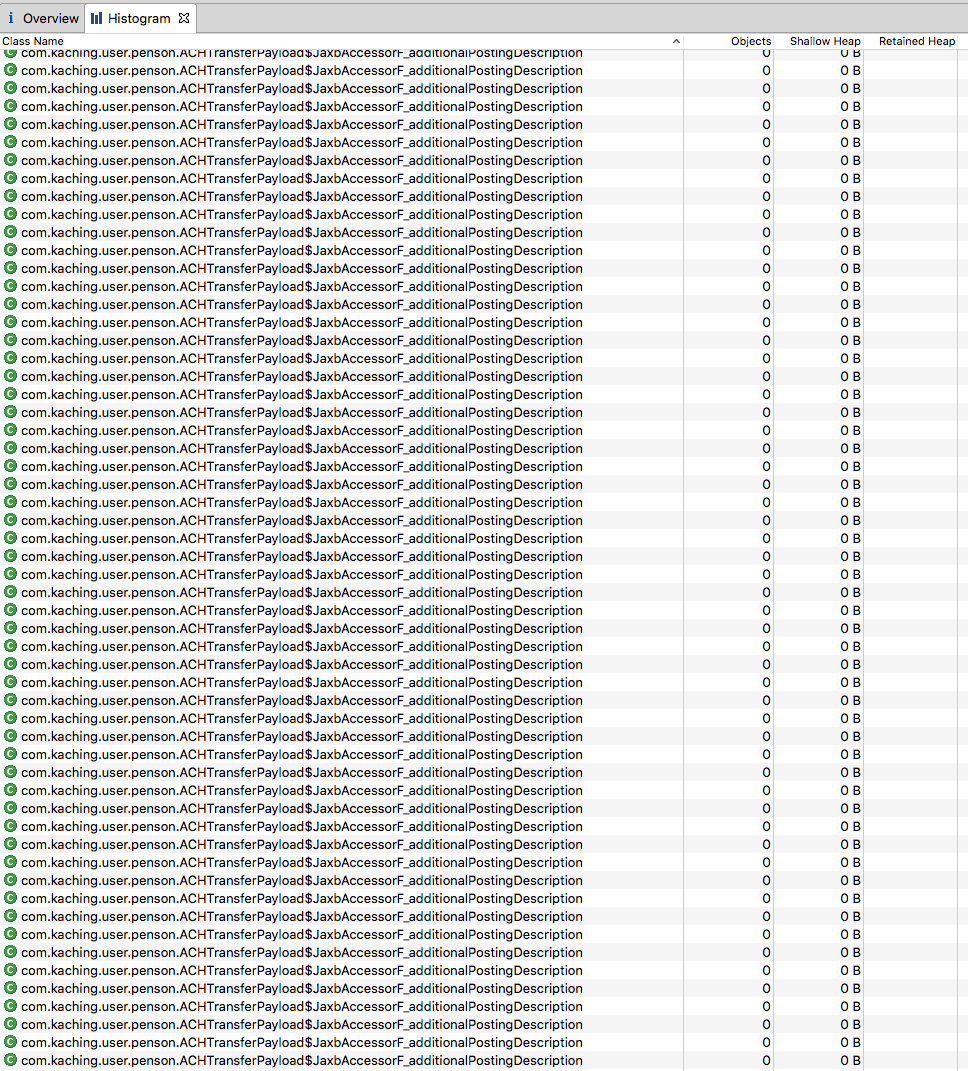
You can get a pretty clear idea of what’s occurring by scrolling through the expanded class list. We are leaking
ACHTransferPayload classes that seem to be related to JAXB.
We didn’t expect items in metaspace (Non-Heap) to be allocated as 0 size, this came as a surprise to us, but it does seem reasonable since it’s off heap. This view was the first identifier of where we thought the memory leak was occurring.
Duplicate Classes
The Duplicate Classes view is basically a super optimized way of identifying the very problem we were experiencing. For future class leaks, this is probably the best view for investigating.
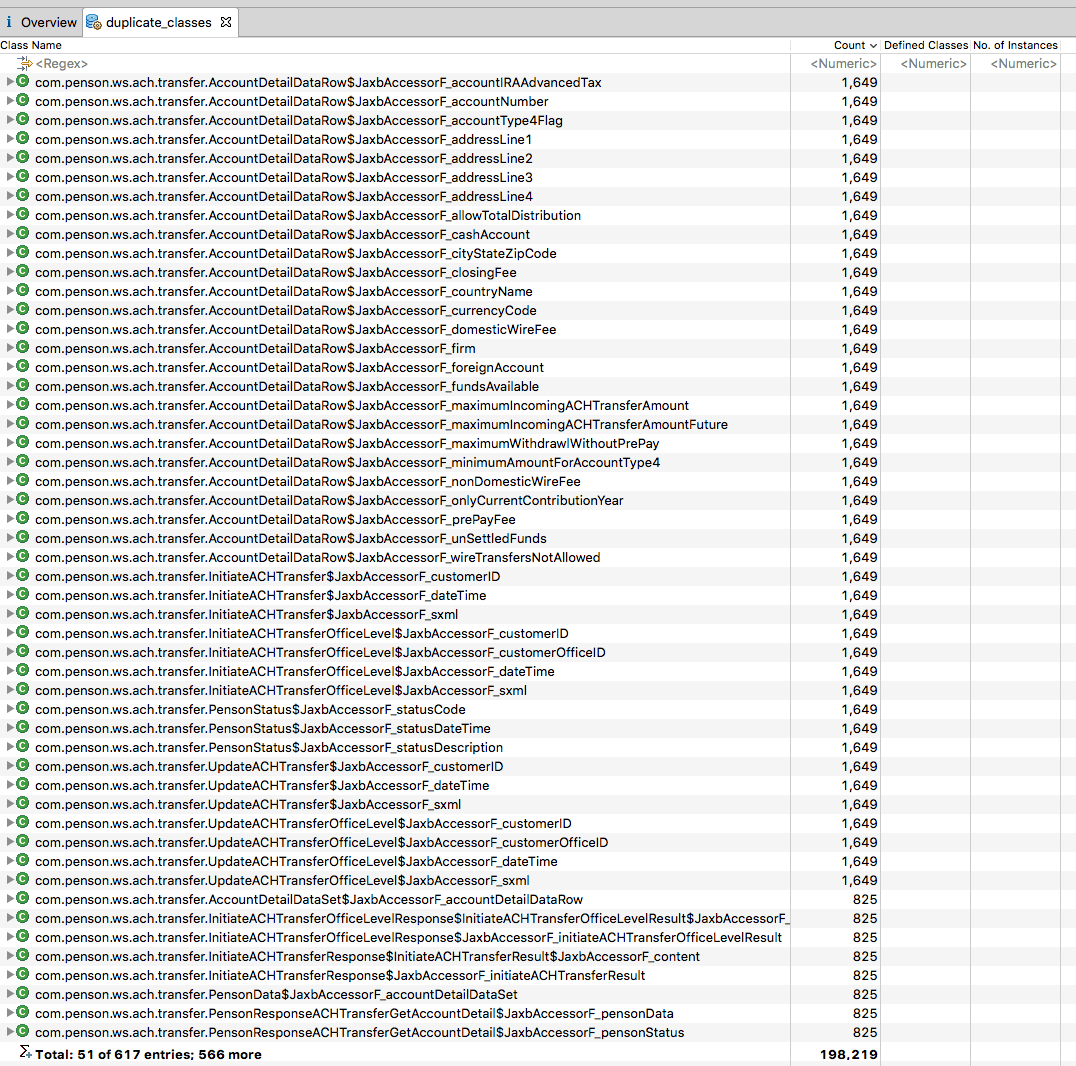
As you can see, after we ran this against our UserManager service the problem becomes straightforward. The class leak is identified as stemming from a number of JAXB objects during ACH transfers. The
com.penson namespace is part of our codebase and JaxbAccessorF is a dynamically generated class.
Resolution
We found that we use JAXB in two different ways throughout our codebase; programmatically with
JAXB and with SOAP services that use
Apache CXF. After a bit of searching it seems that both leaks are related to not using a single shared JAXBContext or JAXBDataBinding.
JAXB:
Using a Single JAXBContext with JAXB
After implementing a singleton to cache our
JAXBContexts, the number of duplicate class types dropped from
617 to 245 entries.
The JAXB fixes:
import static com.google.common.base.Throwables.getRootCause;
import static com.google.common.base.Throwables.propagate;

import java.util.concurrent.ExecutionException;

import javax.xml.bind.JAXBContext;
import javax.xml.bind.JAXBException;

import com.google.common.annotations.VisibleForTesting;
import com.google.common.cache.CacheBuilder;
import com.google.common.cache.CacheLoader;
import com.google.common.cache.LoadingCache;
import com.google.inject.Singleton;

@Singleton
public class JAXBContextHolder {

  private final LoadingCache<Class, JAXBContext> cache =
      CacheBuilder.newBuilder()
          .build(new CacheLoader<Class, JAXBContext>() {
            @Override
            public JAXBContext load(Class clazz) throws Exception {
              return getNewJAXBContext(clazz);
            }
          });

  public JAXBContext getContext(Class clazz) {
    try {
      return cache.get(clazz);
    } catch (ExecutionException e) {
      throw propagate(getRootCause(e));
    }
  }

  @VisibleForTesting
  JAXBContext getNewJAXBContext(Class clazz) throws JAXBException {
    return JAXBContext.newInstance(clazz);
  }

}
Code language: Java (java)
CXF:
Using Single JAXBContext with CXF and
Using a Single JAXBDataBinding with CXF
Similarly, after implementing a singleton to cache our
JAXBDataBindings and reusing the
JAXBDataBindings to create our client proxies, the number of duplicate class types dropped from
245 to 20 entries.
The CXF Fixes:
import static com.google.common.base.Throwables.getRootCause;
import static com.google.common.base.Throwables.propagate;

import java.util.concurrent.ExecutionException;

import org.apache.cxf.jaxb.JAXBDataBinding;

import com.google.common.cache.CacheBuilder;
import com.google.common.cache.CacheLoader;
import com.google.common.cache.LoadingCache;
import com.google.inject.Singleton;

@Singleton
public class JAXBDataBindingHolder {

  private final LoadingCache<Class<?>, JAXBDataBinding> cache =
      CacheBuilder.newBuilder()
          .build(new CacheLoader<Class<?>, JAXBDataBinding>() {
            @Override
            public JAXBDataBinding load(Class<?> clazz) throws Exception {
              return new JAXBDataBinding();
            }
          });

  public JAXBDataBinding getDataBinding(Class<?> clazz) {
    try {
      return cache.get(clazz);
    } catch (ExecutionException e) {
      throw propagate(getRootCause(e));
    }
  }

}
Code language: Java (java)
And the wrapper to make web services consume it:
import java.net.URL;

import javax.xml.namespace.QName;

import org.apache.cxf.jaxws.JaxWsProxyFactoryBean;

import com.google.inject.Inject;

public class JaxWsProxyFactoryBeanFactory {

  private final JAXBDataBindingHolder bindings;

  @Inject
  public JaxWsProxyFactoryBeanFactory(JAXBDataBindingHolder bindings) {
    this.bindings = bindings;
  }

 public JaxWsProxyFactoryBean create(Class<?> serviceInterface, URL wsdlLocation, QName serviceName) {
    JaxWsProxyFactoryBean mojo = new JaxWsProxyFactoryBean();
    mojo.setServiceClass(serviceInterface);
    mojo.setWsdlLocation(wsdlLocation.toString());
    mojo.setServiceName(serviceName);
    mojo.setDataBinding(bindings.getDataBinding(serviceInterface));
    return mojo;
  }

}
Code language: Java (java)
Graphs
Note: The
red arrows represent before our patches,
yellow represents after the JAXB and CXF patchset, and
blue is after identifying the last remaining class leaks.
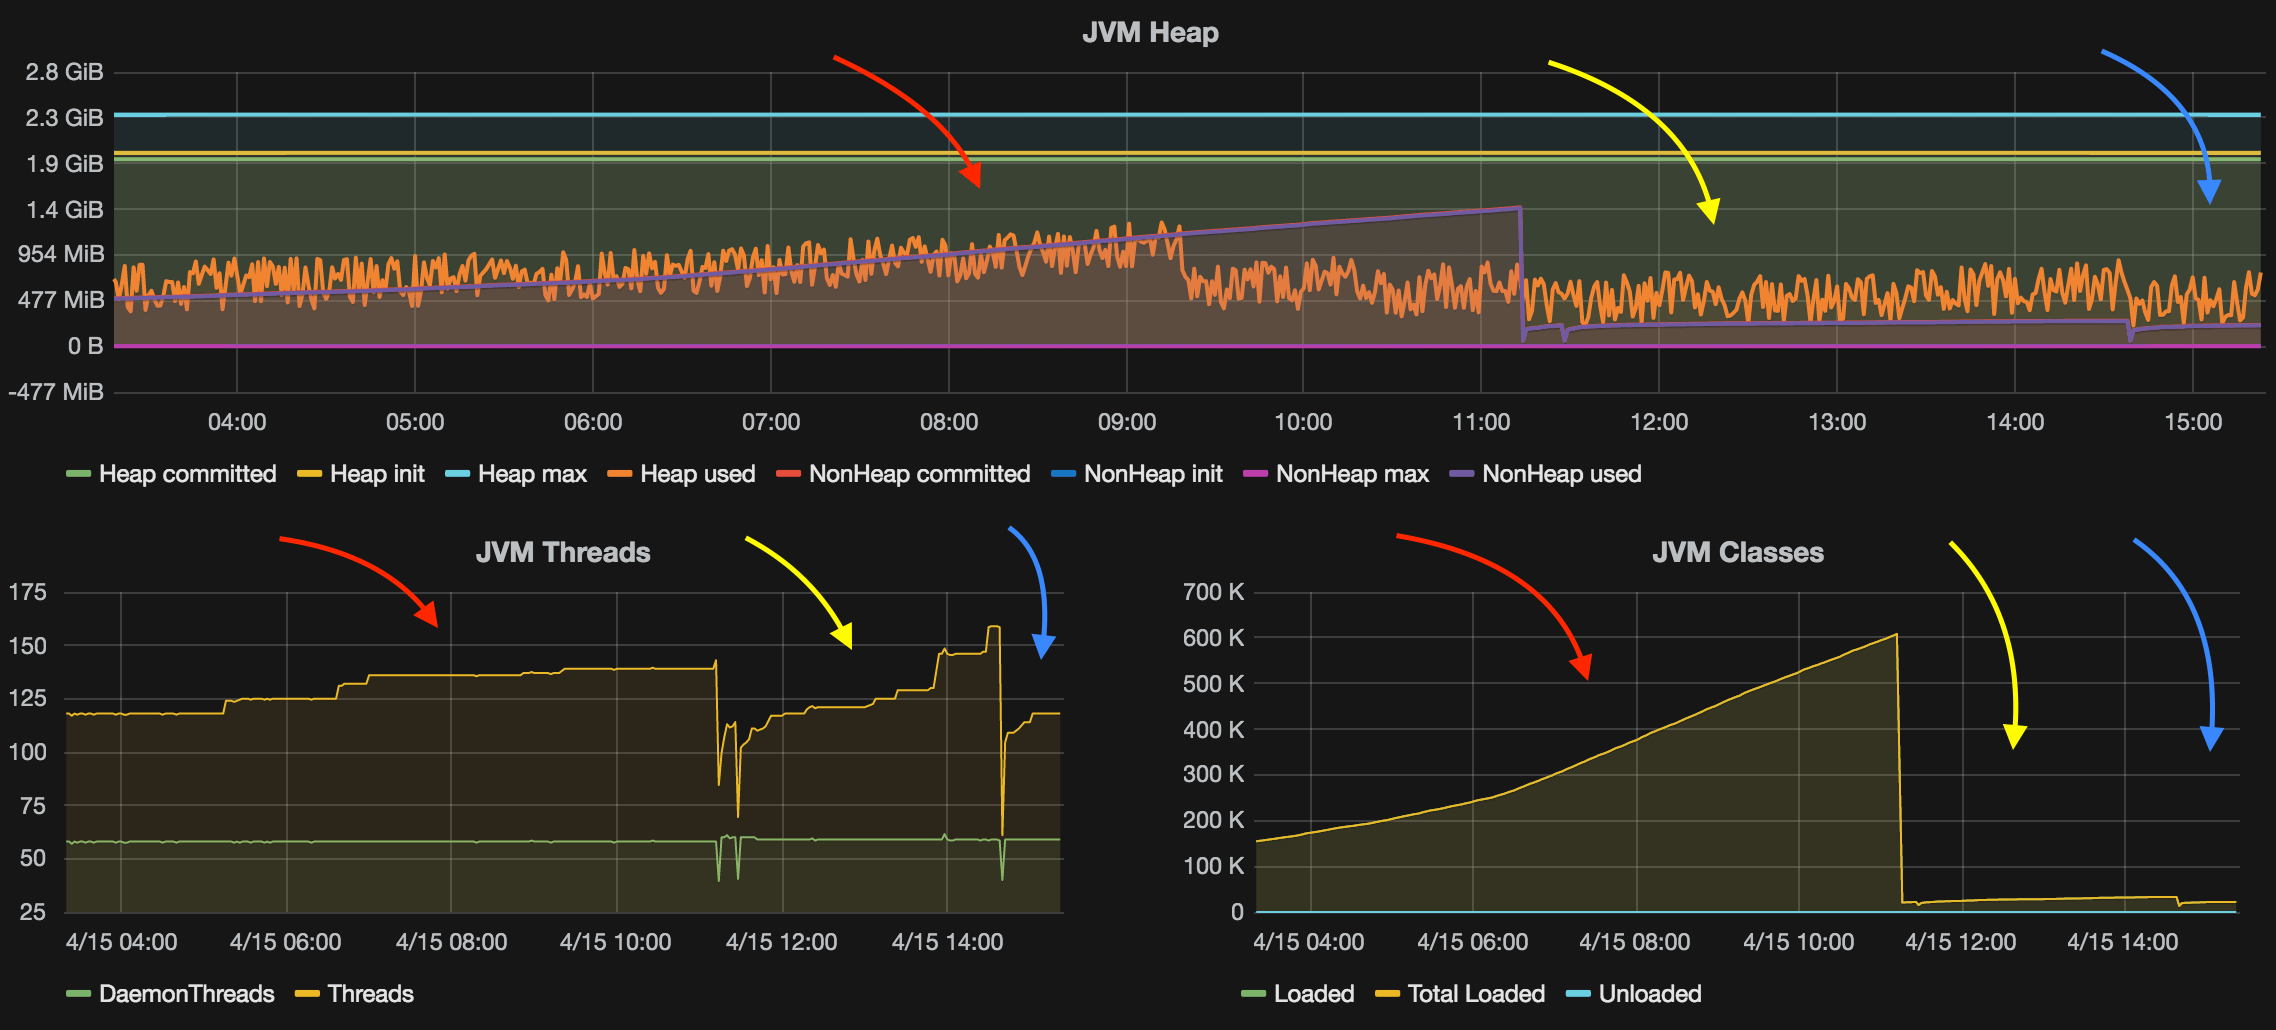
In association with the heap allocations, you can see the GC behavior calms down to match:
Thanks to
Shuyang Fang, Akshay Nathan, and Scott Fritz for providing the patches for our JAXB and CXF implementations.
Findings
The strategies used to identify heap and object issues should differ entirely. After going through this exercise ourselves we’d suggest the following order when tracking down potential heap issues:
Object Leaks (or other Heap items)
- Dominator Tree (Biggest Objects)
- Top Consumers (Most Expensive Objects)
- Duplicate Classes (Multiple class loaders)
- Histogram (Number of instances per class)
Class Leaks (or other Non-Heap items)
- Duplicate Classes (Multiple class loaders)
- Histogram (Number of instances per class)
- Dominator Tree (Biggest Objects)
- Top Consumers (Most Expensive Objects)
Join us
Interested in this type of engineering work? We’re looking for great folks to
join us.
 What we see here is that we have a forever-growing non-heap allocation, which seems to be directly related to the number of JVM classes. Additionally, 1M+ classes is a staggering amount and definitely displays unusual activity.
 Associated with the larger heap (and growth in class count), we also observed that our CMS and ParNew Collections were growing out of hand. You can see above, the ParNew GC Time directly correlates with the number of JVM classes, the growth of Heap, and the forever growing Non-Heap allocations. In general, the more classes we have the larger the
 We’ve put all three of the default views beside each other to visually show the growth over time. From left to right the views are at initial load, 45 minutes later, and 3 hours later, respectively.
At application startup nothing stands out as particularly odd, at this point we couldn’t definitively identify good from bad. Although, it’s clear that there are many objects/classes which are smaller than 4.2MB of retained size. At the 45 minute mark, it appears the heap continues to grow without bounds, but we are not yet sure of the culprit. Finally at 3 hours, although we cannot yet identify the specific issue yet, it’s clear that this leak is a match to what we are seeing in grafana.
In addition to the retained size pie chart, there are also a number of actions you can run against your heap as shown below.
 Each of these are pretty useful by themselves. Typically we’ll walk these items in the following order:
 Above is our
  You can get a pretty clear idea of what’s occurring by scrolling through the expanded class list. We are leaking
  As you can see, after we ran this against our UserManager service the problem becomes straightforward. The class leak is identified as stemming from a number of JAXB objects during ACH transfers. The
  In association with the heap allocations, you can see the GC behavior calms down to match:
 Thanks to Shuyang Fang, Akshay Nathan, and Scott Fritz for providing the patches for our JAXB and CXF implementations.