What is a Persistent Queue?
A persistent queue is a list of objects that persist in the database waiting to be polled and processed in some way. Usually it is a table that has columns for data, timestamp of when the object persisted, and timestamp of when the object is polled. As opposed to an in-memory queue, a persistent queue lives on non-volatile memory that is bound to have longer access time than volatile memory.
Why Are Persistent Queues Important for Wealthfront?
At Wealthfront, we have built our backend into modular services that talk to each other through networking. We have adopted this model to keep our code modular. Thus, we need a persistent message queue to send information between services. Although
RabbitMQ is the industry standard for message queues, it does not provide the adequate persistence that we need.
A typical persistent queue entity should extend an abstract class like the following example, and map to the database using an ORM like
Hibernate:
public abstract class AbstractQueuedObject {
  private DateTime persistedTime;
  private DateTime polledTime;
  private DateTime sentTime;
}
Code language: Java (java)
How to Identify A Slow Persistent Queue
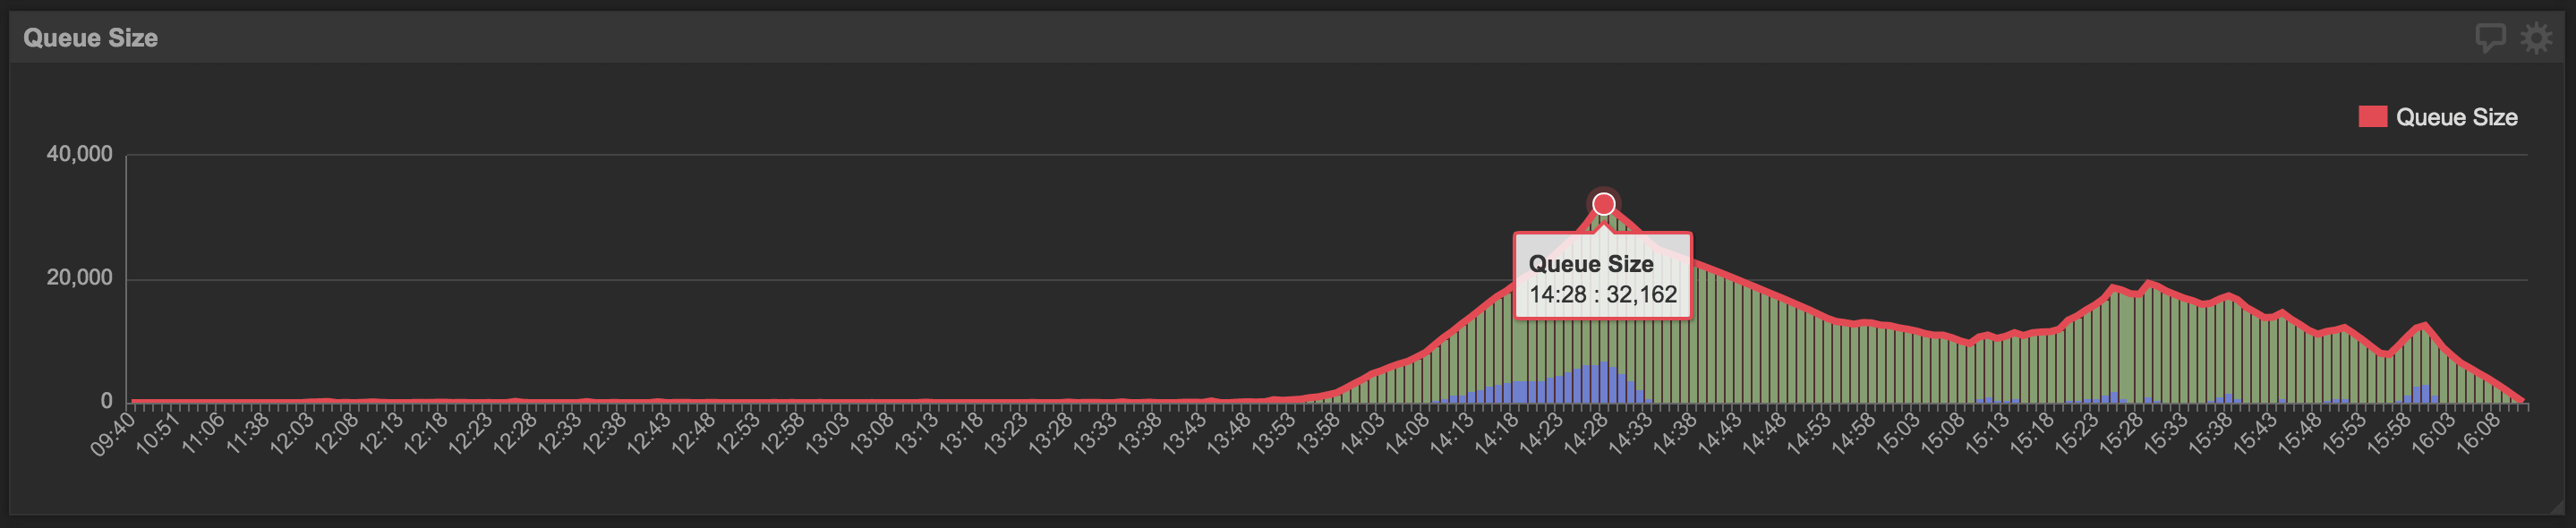
In general, if the persistent queue is constantly growing in size, that is, the number of objects waiting to be polled and processed increases without bound, the persistent queue is slow. A healthy persistent queue may increase in size from time to time under heavy load and the average size of the queue should be close to 0. A sample PSQL snippet below will output the minute by minute size of the persistent queue.
WITH persisted_rate AS (
    SELECT
      date_trunc('minute', persisted_time) AS persisted_minute,
      count(*)                             AS num_persisted
    FROM persistent_queue_table
    GROUP BY persisted_minute
),
    polled_rate AS (
      SELECT
        date_trunc('minute', poll_time) AS poll_minute,
        count(*)                        AS num_polled
      FROM persistent_queue_table
      GROUP BY poll_minute
  ),
    total_objects_persisted_by_minute AS (
      SELECT
        persisted_minute,
        (
          SELECT sum(num_persisted)
          FROM persisted_rate persisted_rate_2
          WHERE persisted_rate_2.persisted_minute <= persisted_rate_1.persisted_minute
        ) AS running_persisted_sum
      FROM persisted_rate persisted_rate_1
  ),
    total_objects_polled_by_minute AS (
      SELECT
        poll_minute,
        (
          SELECT sum(num_polled)
          FROM polled_rate polled_rate_2
          WHERE polled_rate_2.poll_minute <= polled_rate_1.poll_minute
        ) AS running_polled_sum
      FROM polled_rate polled_rate_1
  )
SELECT
  persisted_minute                             AS minute,
  (running_persisted_sum - running_polled_sum) AS queue_size
FROM total_objects_persisted_by_minute
  INNER JOIN total_objects_polled_by_minute
    ON persisted_minute = poll_minute
ORDER BY minute;
Code language: SQL (Structured Query Language) (sql)
At Wealthfront, we use
Klipfolio to visualize our data.
How to Make Persistent Queues Faster Safely
First, check if the persistent queue is already under database contention. A typical flow of an object in the persistent queue looks like:

As shown in the flowchart above, in order to process one object in the persistent queue, the application has to make three writes and one read requests to the database. This can be quite expensive and result in contention even if the application only has one thread for persisting the queued objects and another thread polling and sending the queued objects. In order to gauge how well the persistent queue is performing, use the PSQL below to find out how fast objects are being persisted (aka written to the database) and polled, i.e. read.
WITH persisted_rate AS (
    SELECT
      date_trunc('minute', persisted_time) AS persisted_minute,
      count(*)                             AS num_persisted
    FROM persistent_queue_table
    GROUP BY persisted_minute
),
    polled_rate AS (
      SELECT
        date_trunc('minute', poll_time) AS poll_minute,
        count(*)                        AS num_polled
      FROM persistent_queue_table
      GROUP BY poll_minute
  ),
SELECT
  persisted_minute AS minute,
  num_persisted,
  num_polled
FROM persisted_rate
  INNER JOIN polled_rate ON persisted_minute = poll_minute
ORDER BY minute;
Code language: SQL (Structured Query Language) (sql)
Speeding Up By Introducing Parallelism
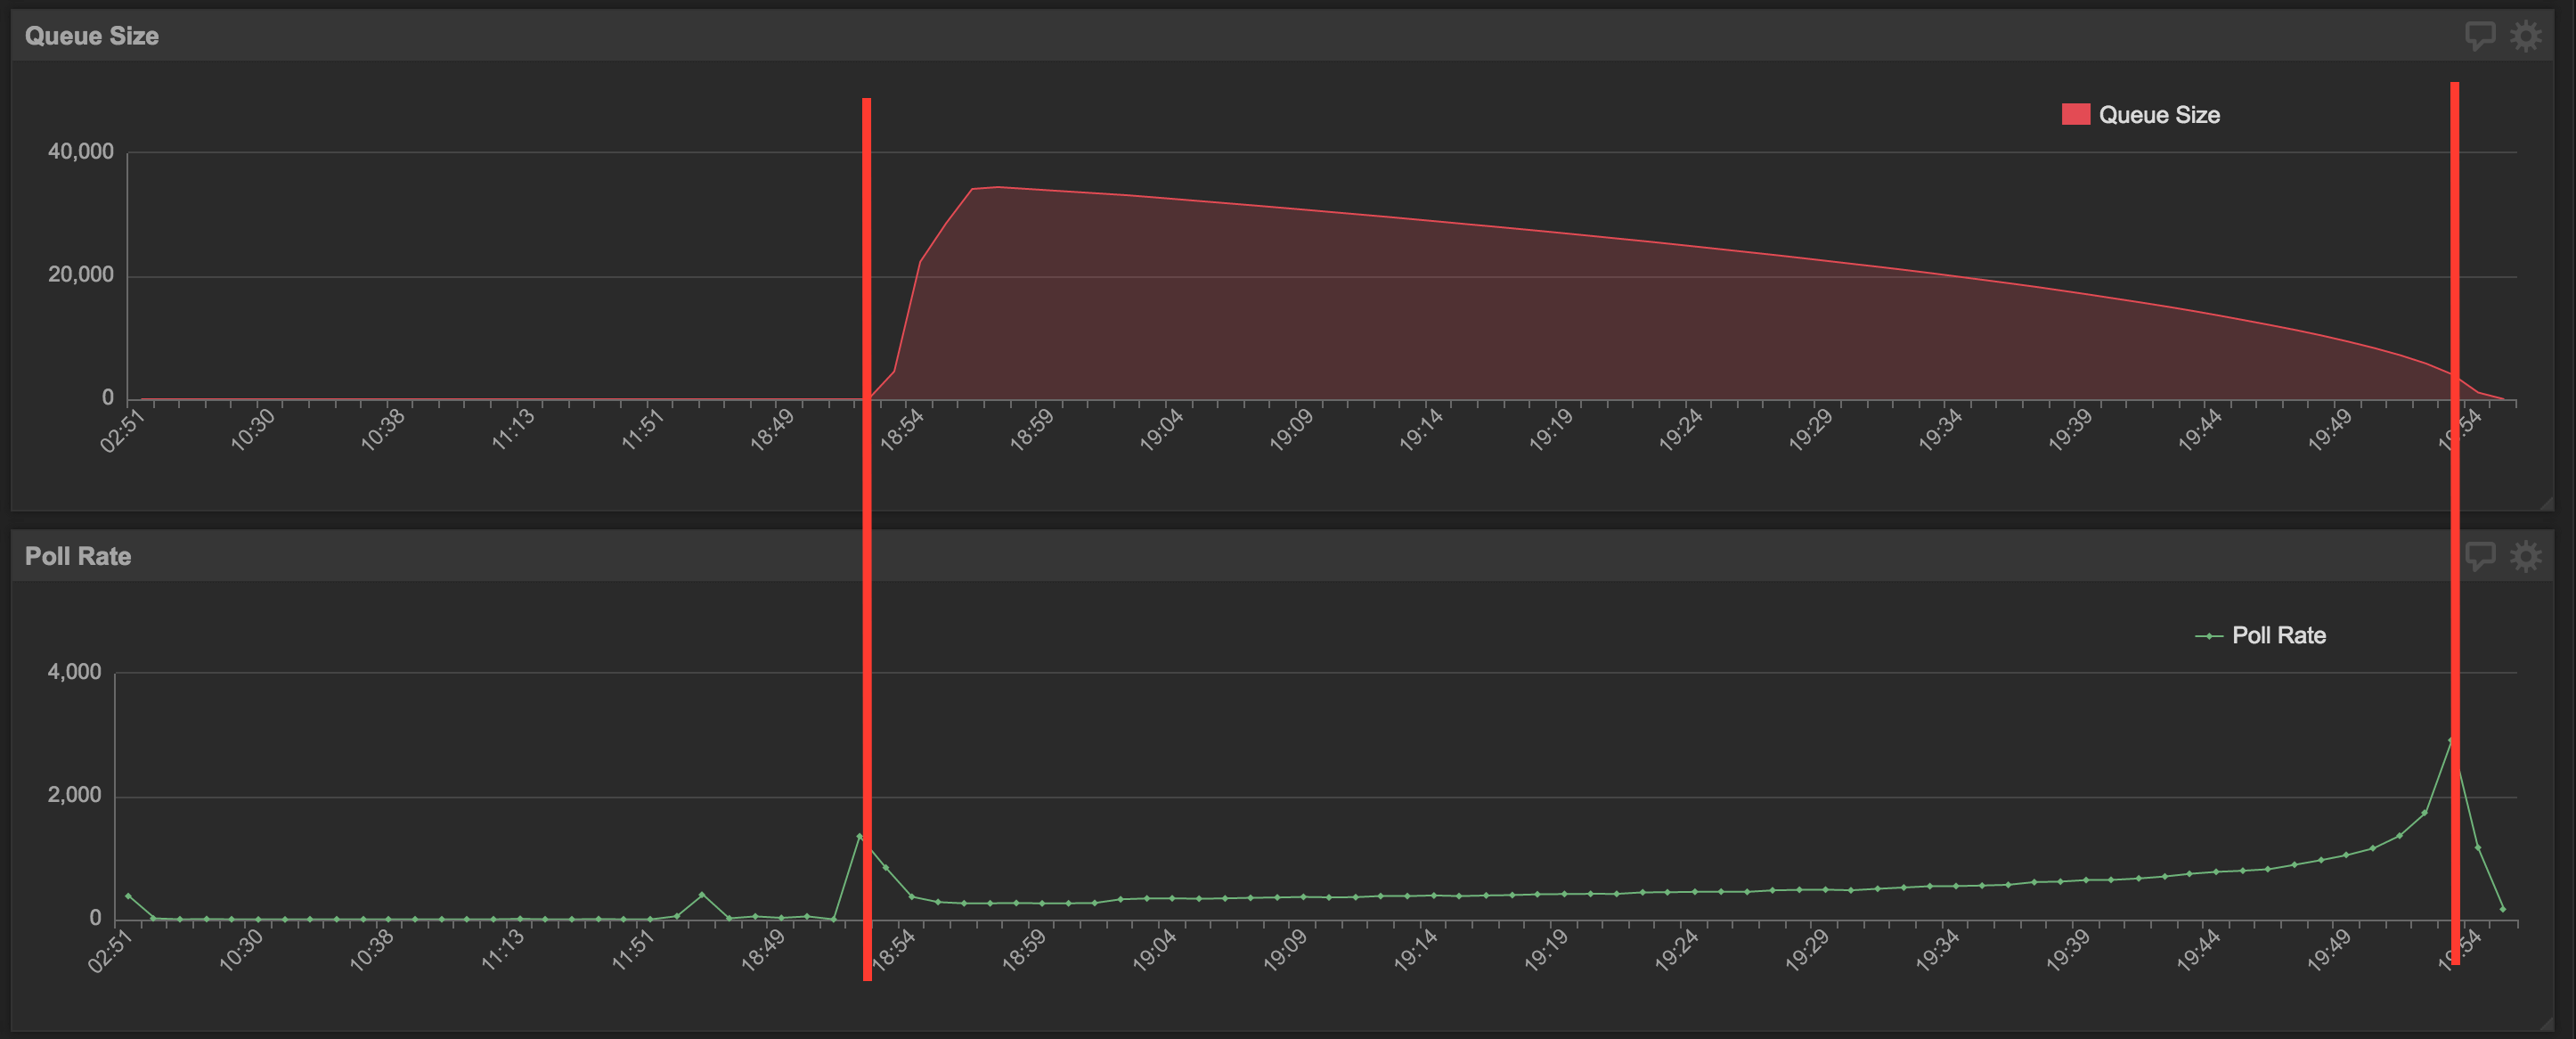
If the output looks something like the diagram shown below, where the persistence and poll rates are uncorrelated, and the poll rate is constant, it means that there is no contention in the database between reads and writes. The accretion in queue size is simply because the persisting thread is creating objects faster than the polling thread.
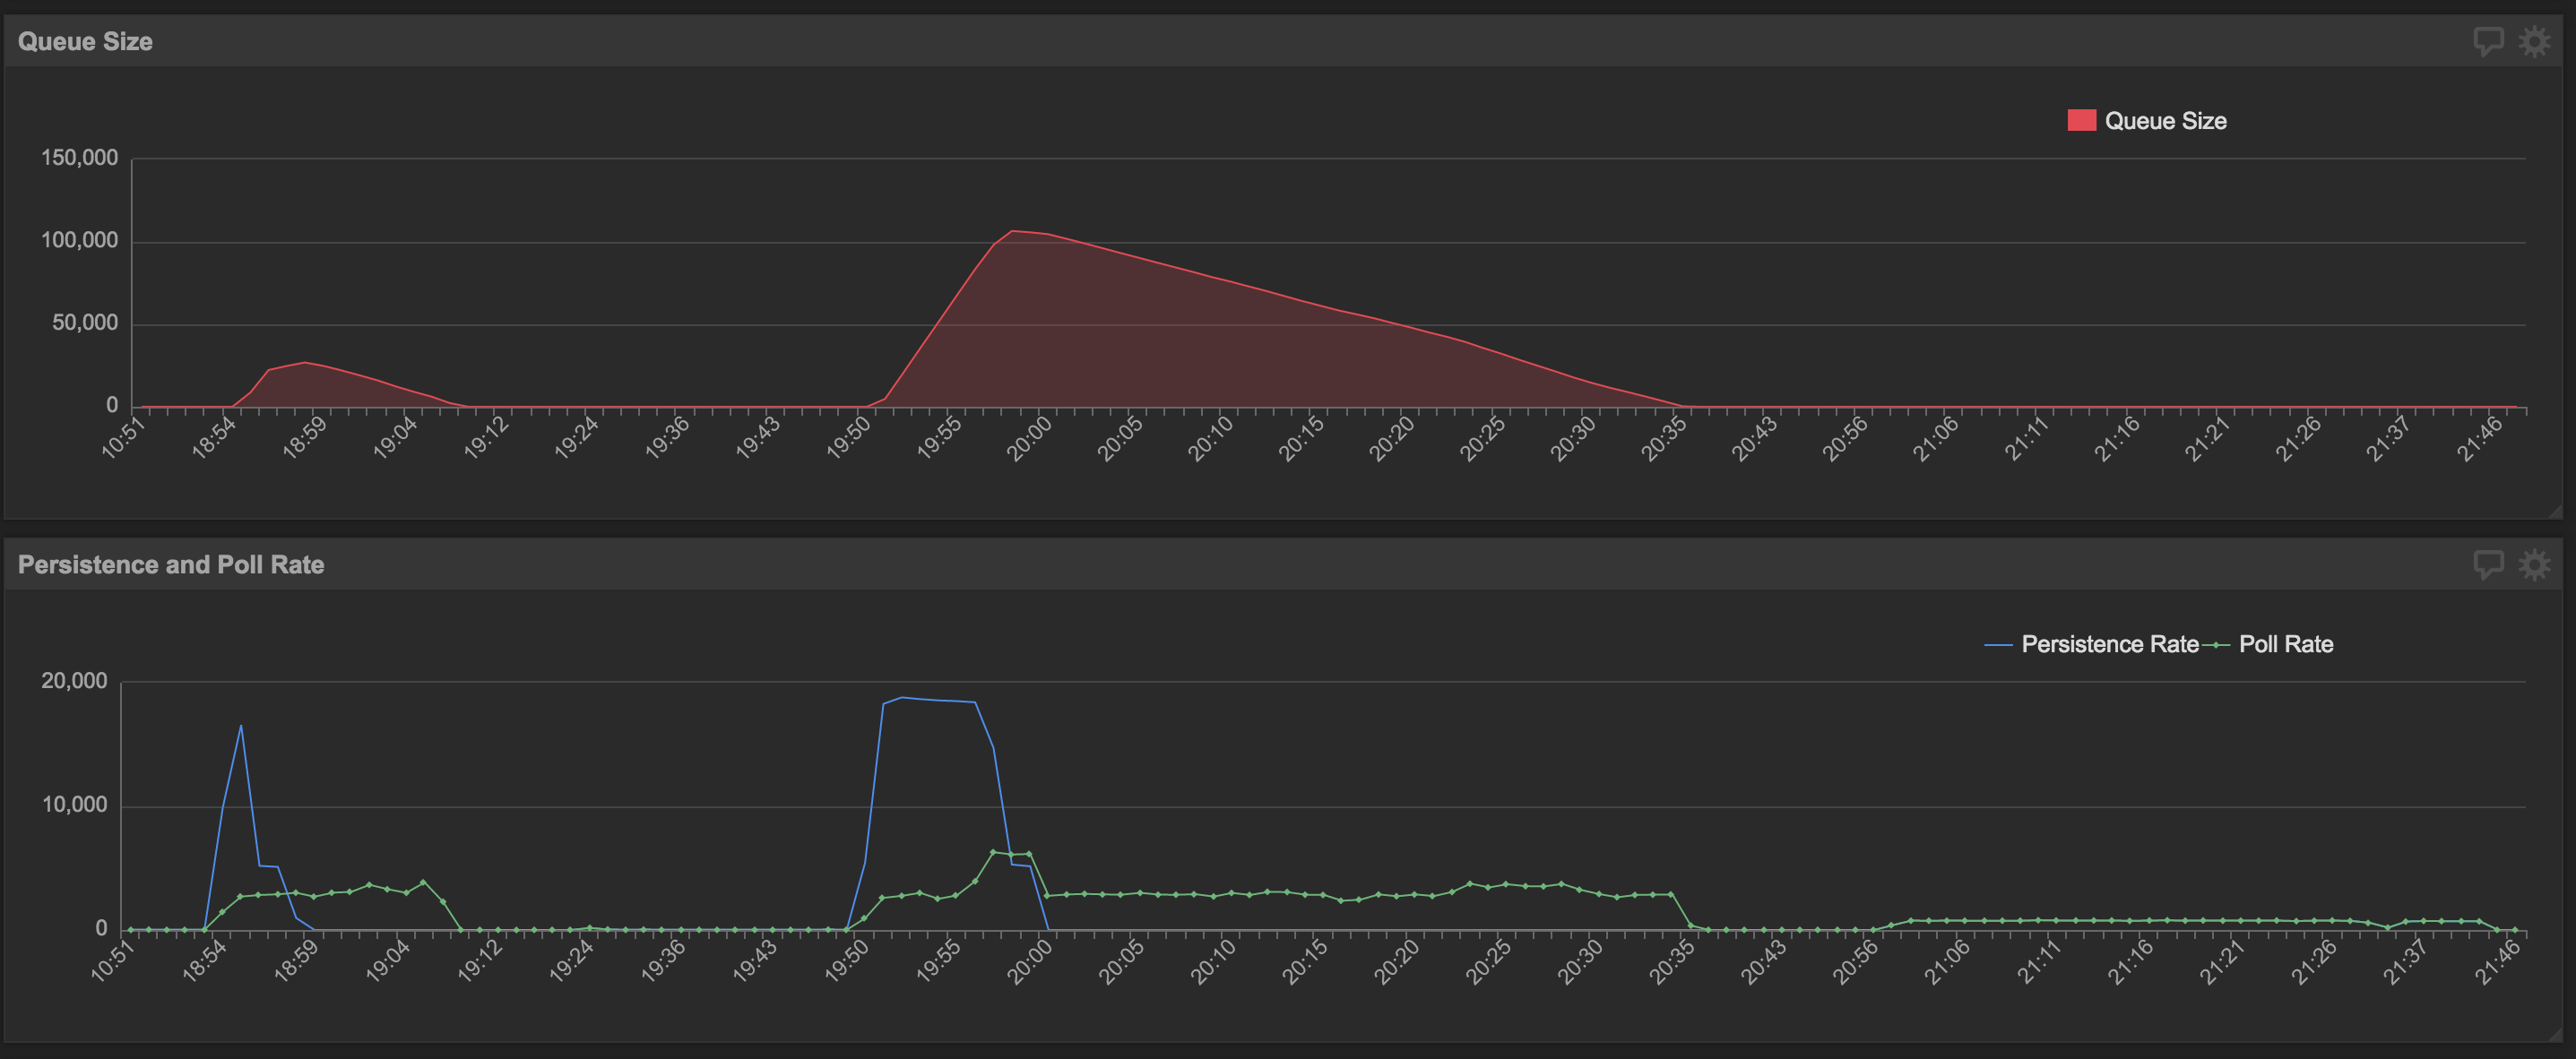
One way to make a persistent queue in this situation faster is to add more threads to poll the queue. However, when introducing parallelism, atomicity comes into concern. At Wealthfront, we use
Hibernate Sessions to make sure when threads interleave, that is, when two or more threads are polling on the same object, only one will succeed and the others will automatically roll back. You can also use locks to ensure atomicity depending on how your particular application is set up.
Speeding Up By Batching
However, if the persistent rate and the poll rate are inversely proportional, then it means the database is contentious. It may be because the program has too many threads adding objects to the queue, taking more time writing to the database. Or writing to the database is very expensive and is locking up the table for a longer time. If parallelism was recently introduced to the application as mentioned in the section above and contentious behavior is starting to be observed, it means too much parallelism was introduced.
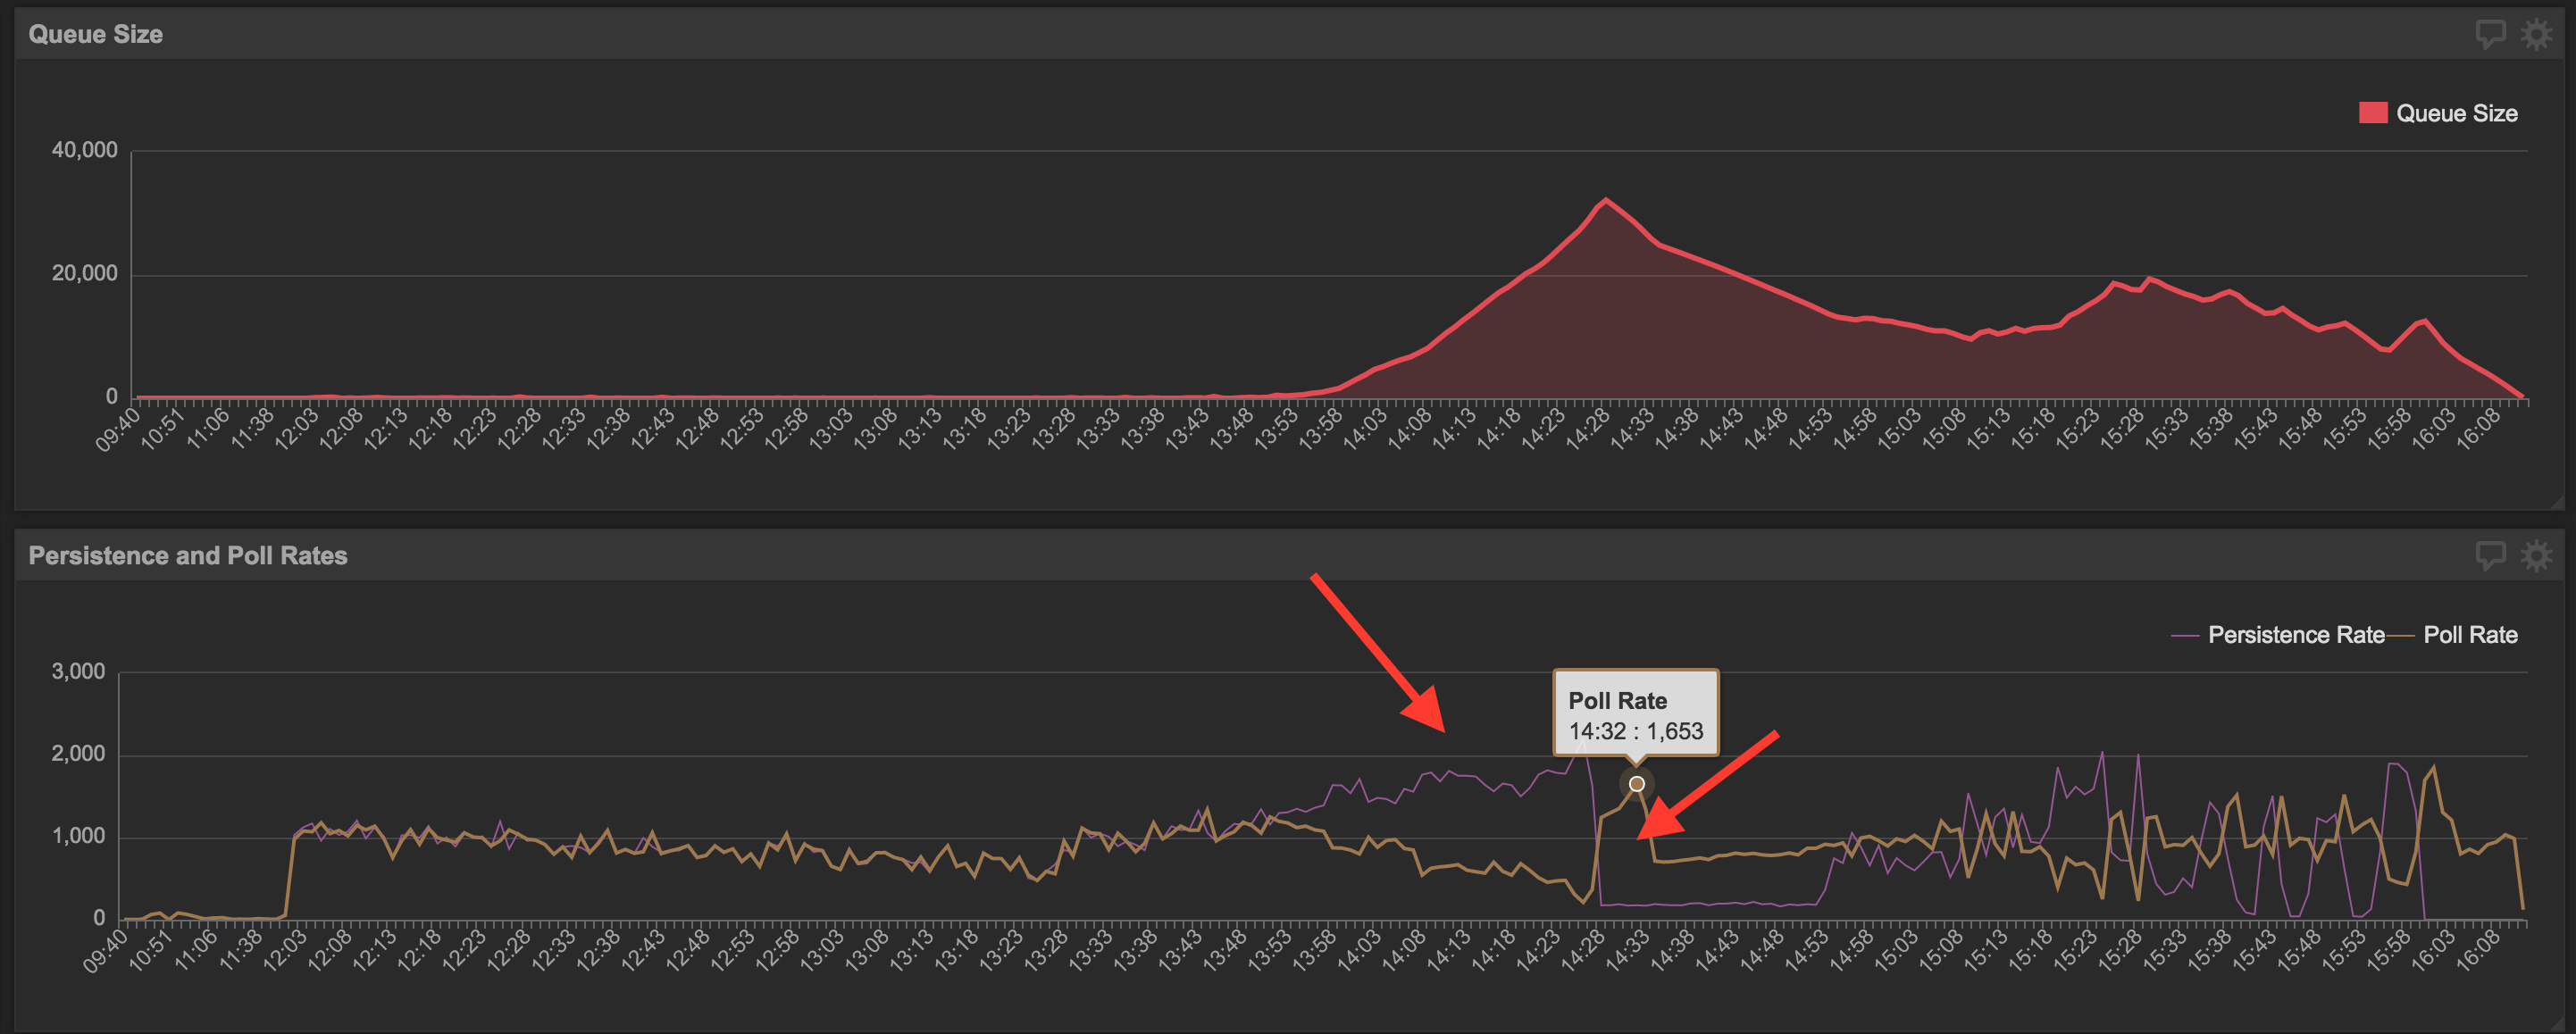
In order to tackle this kind of slow persistent queue performance, the first course of action is to try speeding up the application’s reads and writes – whether it is through optimizing the SQL or optimizing the indices on the database (more on that later). Another method to speed up a queue in this situation is through batching. Rather than having each polling thread poll one object at a time from the database, poll a batch and process them one by one in memory. The batch size can be two to infinity depending on your application. This method works by limiting the number of database connections the application opens and closes, since those can take significant time at a large scale. In addition, sending a batch of objects through the network from one service to another decreases the number of HTTP requests the application has to make.
Useful Tips Regarding Optimizing SQL Performance
1. Ensure your SQL is actually hitting indexes in the database
When we were parallelizing our own persistent queues, we observed that by adding more polling threads, the rate at which the multithreaded application polls became slower than the rate of a single thread. Additionally, we noticed the poll rate was faster when the queue size was small and slower when the queue size was large.
This looked like a behavior or slow read speeds due to not hitting indexes in the database, as the SQL query has to search row by row for the oldest unpolled objects from all unpolled objects. When the queue is small there are less unpolled object to search from, but when the queue size is large, the database has to search through a lot of rows increasing the read time. At that time the SQL and index that were running in our InnoDB flavor of MySQL was this:
SELECT * FROM persistent_queue_table WHERE polled_time IS NOT null AND sent_time IS NOT null ORDER BY id;
ADD INDEX polled_time_sent_time (polled_time, sent_time);
Code language: SQL (Structured Query Language) (sql)
This piece of SQL and index seem
correct despite the id not being present in the multicolumn index. It is because in InnoDB, each record in a secondary index contains the primary key columns for the row, as well as the columns specified for the secondary index. InnoDB uses this primary key value to search for the row in the clustered index. However, the data above has shown us otherwise. It
turns out doing an ORDER BY on an InnoDB table never guarantees proper index selection due to its internal index organization. Therefore, it is always recommended to add all of the columns the SQL references into the multi-column index.
ADD INDEX polled_time_sent_time_id (polled_time, sent_time, id);
Code language: SQL (Structured Query Language) (sql)
2. Don’t use “not in” in your SQL
In a multithreaded program it makes intuitive sense to maintain a set of ids that uniquely identifies which queued objects are currently in flight by other threads. Then, inside the polling SQL, use a “not in” clause to explicitly exclude queued objects that are in flight. However, “not in” clause does not play well with indexes. Having a “not in” clause will often render the multicolumn indexes useless. The multicolumn indexes are B-Trees. Searching through an B-Tree for a specific value is fast, while searching for values “not in” a set would require going through all the nodes in the B-Tree.
| method |
total number of times polled |
number of times the polled object is not in flight |
% of total |
number of times the polled object is in flight |
% of total |
time |
| using “not in” clause |
102,942 |
37,960 |
36.8 |
64,982 |
63.2 |
30 mins |
| not using “not in” clause |
271,035 |
47,200 |
17.4 |
223,835 |
82.6 |
7 mins |
The above chart shows the statistics collected when processing the same amount of queued events. True, not using the “not in” clause resulted in polling a lot more objects that are in flight being processed by other tread, so the current thread has to abort it and poll again. However, because the SQL is utilizing indexes when not using the “not in” clause, it is overall much faster. It took less than 1/4 of the time than using the “not in” clause despite making 3x more queries to the database.
3. When moving to multithreads or changing indexes, test for performance in addition to correctness
Multithreaded programs are inherently harder to test. Unit tests may give confidence in the correctness of code, but it does not simulate how the JVM will schedule a multithreaded application nor provide insight on how fast the production database is when processing hundreds of thousands persisted queued objects. Therefore, when making the move to a single threaded program to a multithreaded program, or changing your SQL/indexes on tables where performance is important, it is always a good idea to test for performance in addition to correctness. One way to do that is to set up a fake service that mirrors the production service, write a query that will generate large quantities of fake persisted objects automatically, and measure the performance using the SQL provided above.
Conclusion
Two ways of speeding up a persistent queue have been presented. Depending on the situation, one can:
- Add more threads to poll the persistent queue.
- Batch poll and batch send
Remember, make sure you are hitting indexes on your database. If you are using MySQL, the
EXPLAIN command is particularly helpful. When going multithreaded, test for performance in addition to correctness.
Join us
Interested in this type of engineering work? We’re looking for great folks to
join us.